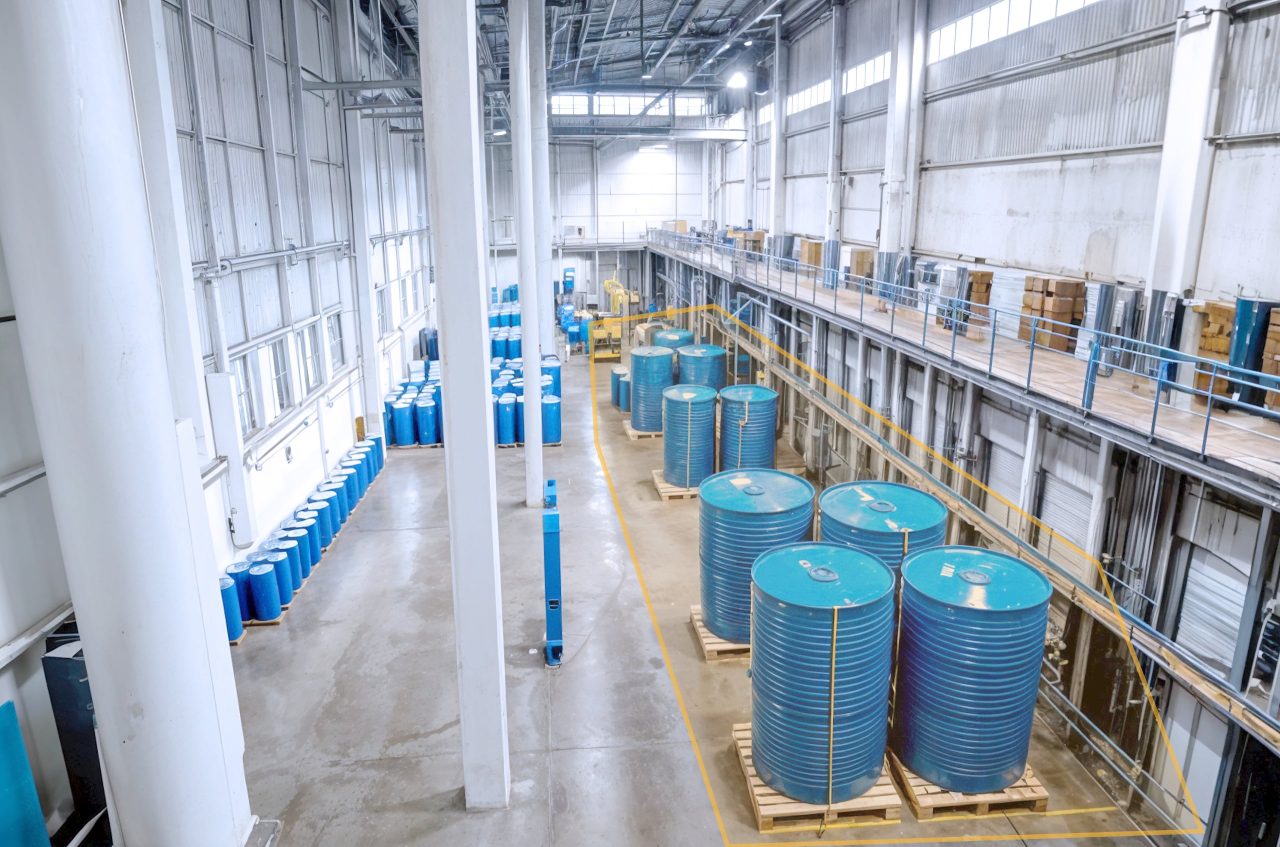
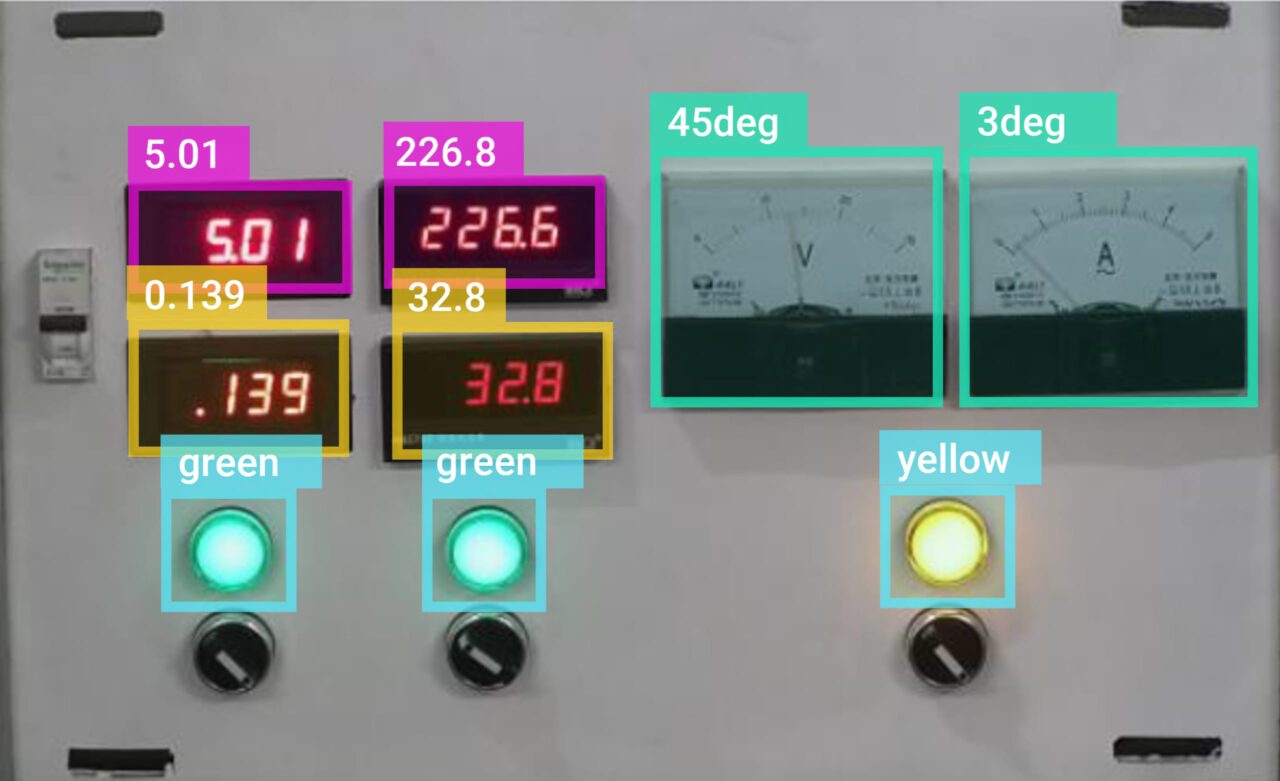
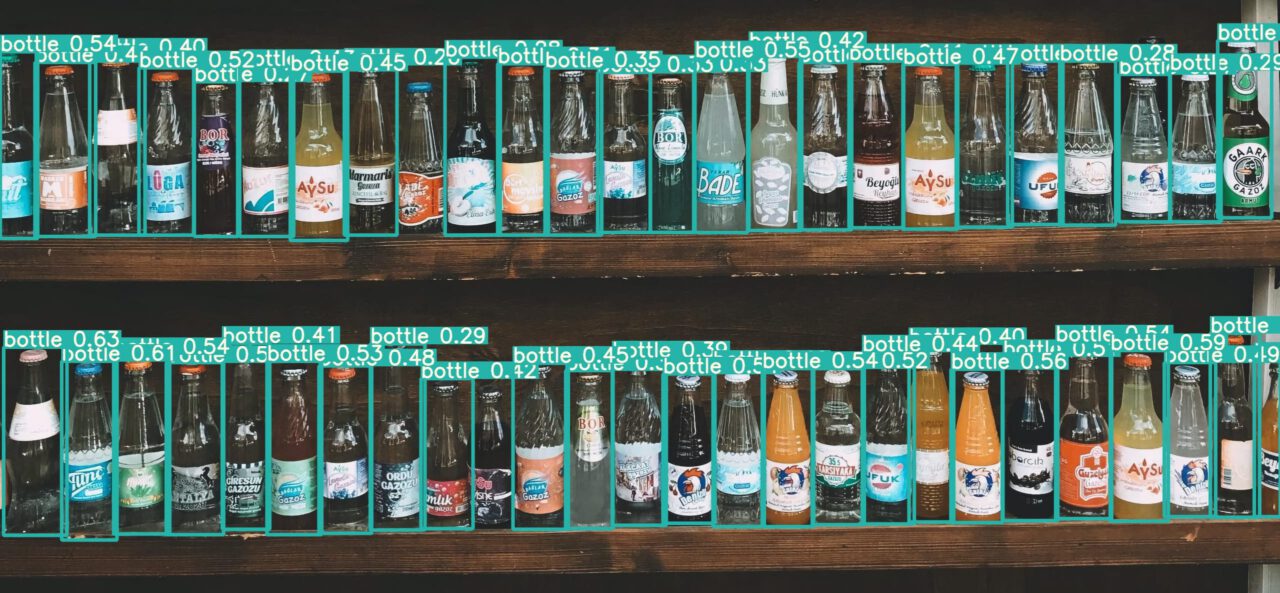
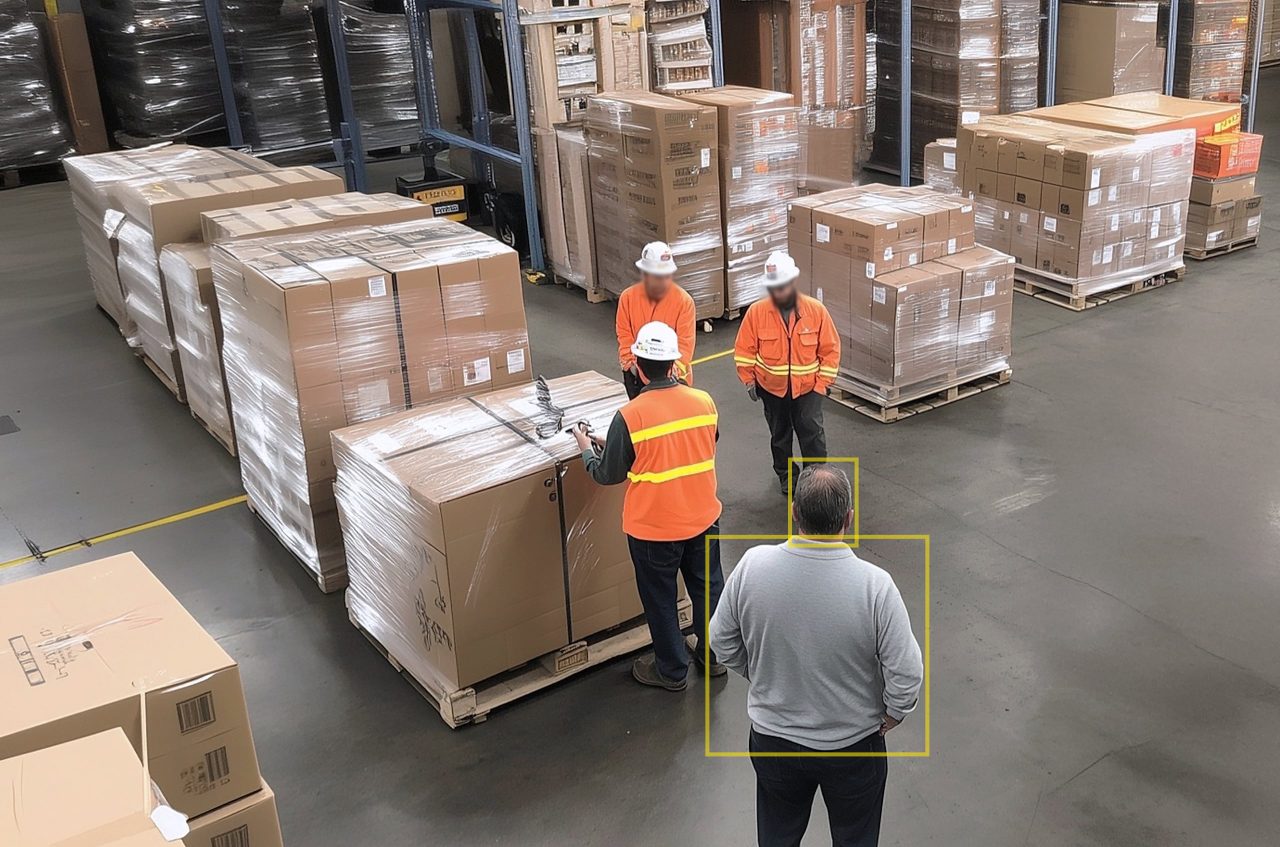
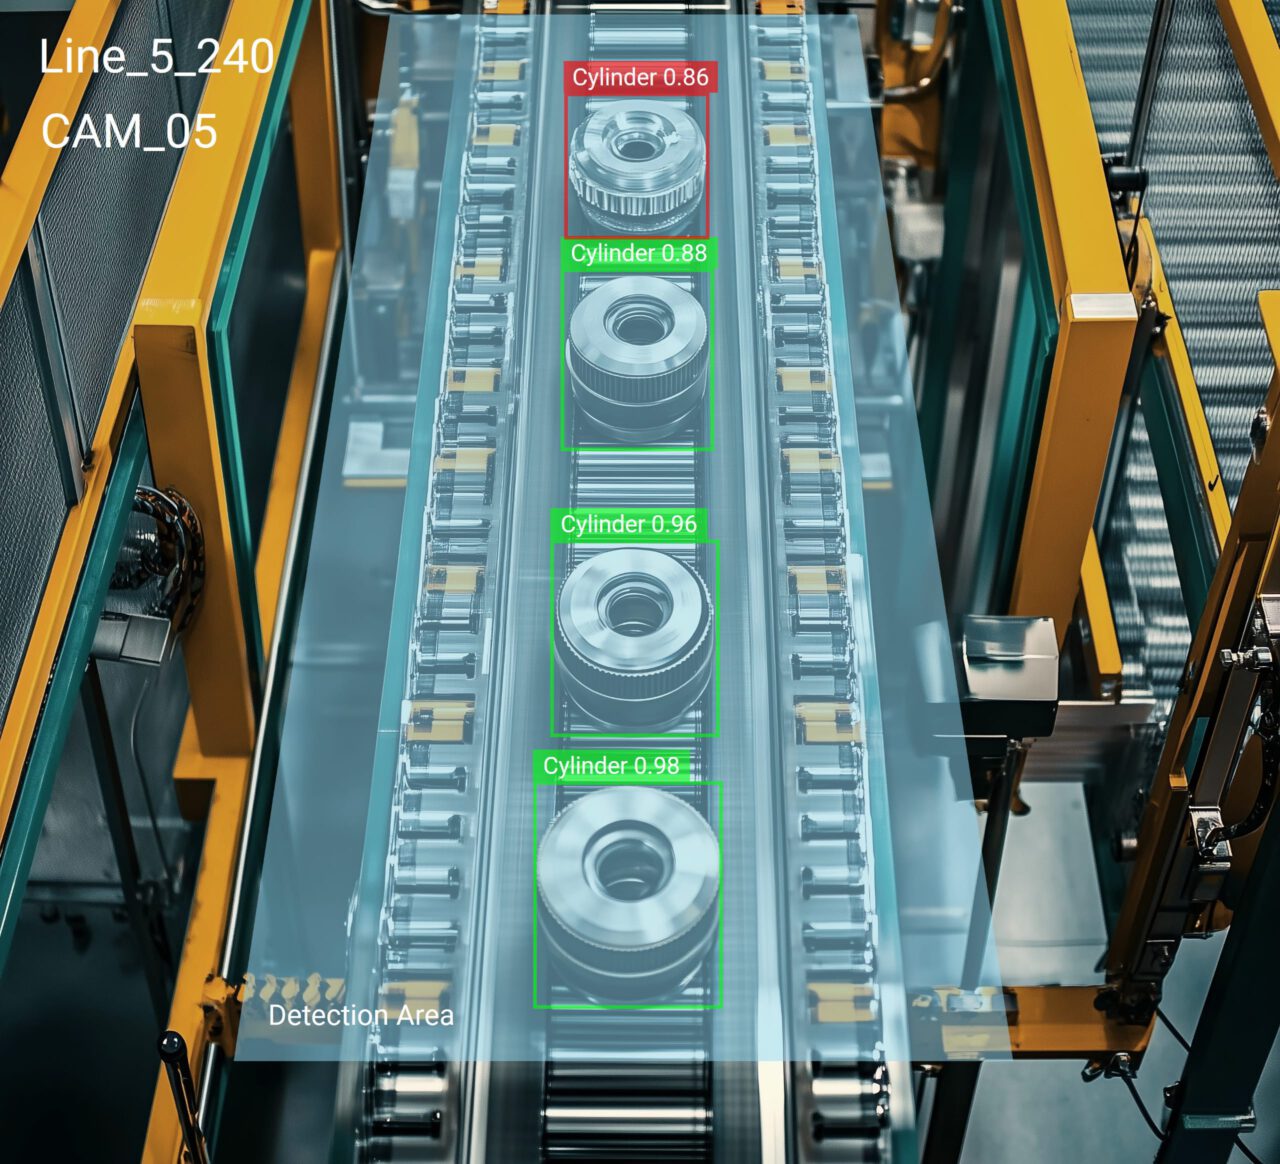
One platform. Every use case. Superior performance.
Unify your computer vision applications on one platform that’s easy to use, delivers ROI in no time, and transforms operational visibility into your competitive edge.
Viso Suite is the infrastructure behind enterprise computer vision
Intelligent data capture at scale
Viso Suite automates the process of collecting high-quality training data, making it faster and more reliable to build and improve visual AI.

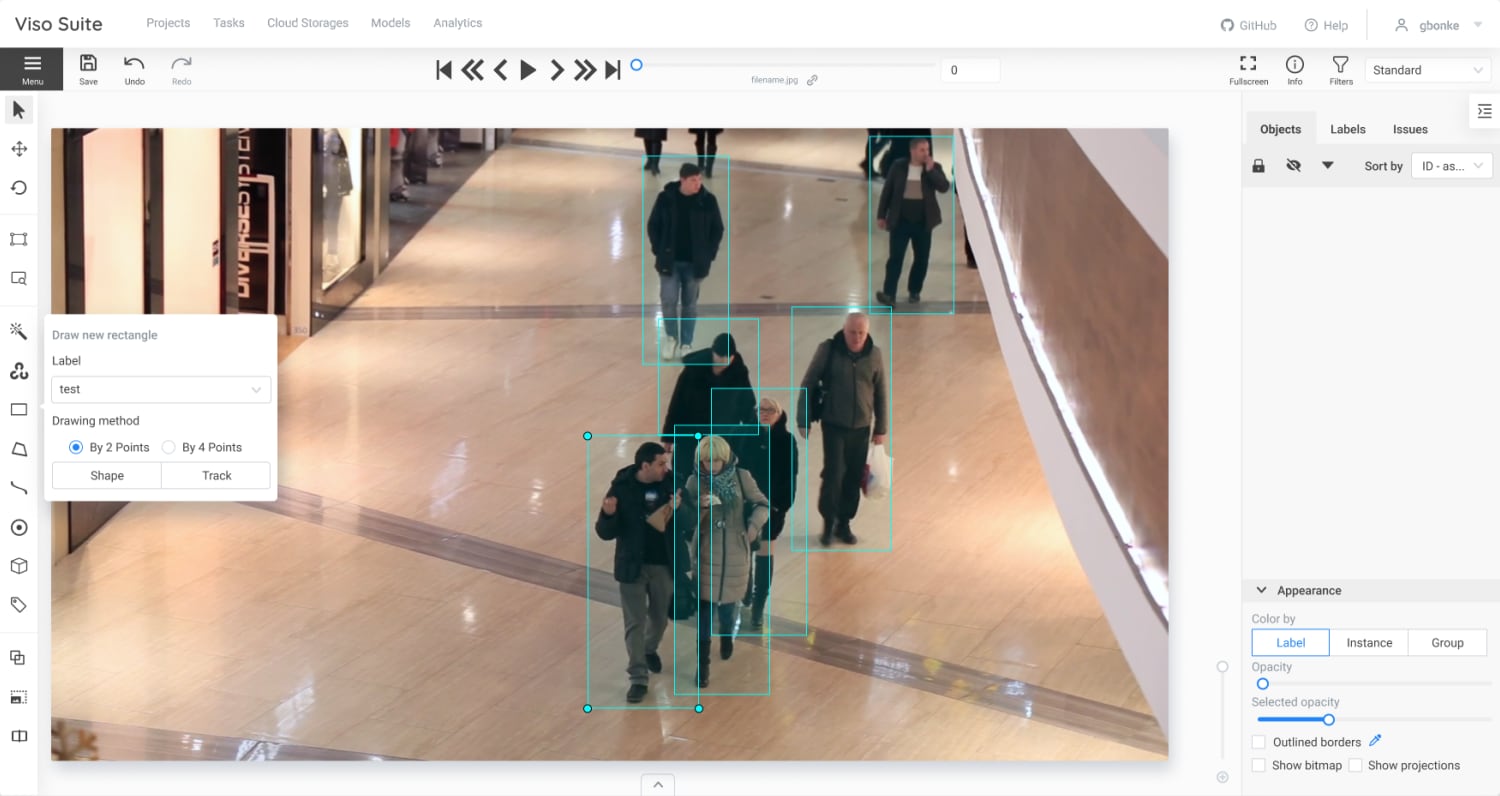
Scalable, collaborative labeling
Create high-quality datasets with tools designed for multi-user annotation workflows, data control, and rapid iteration.

Flexible model training across frameworks
Train, manage, and improve computer vision models with full control across frameworks, environments, and versions.

Visual app creation without compromise
Design and evolve computer vision applications faster using a visual editor and reusable logic components.

Scalable, controlled application delivery
Viso Suite makes it easy to deploy applications to thousands of edge devices, securely and without downtime.

Seamless edge-to-cloud orchestration
Ensure all your devices and applications stay in sync with secure, low-latency connectivity across the entire stack.

Real-time visibility and operational insight
Viso Suite provides rich observability with customizable dashboards, live alerts, and enterprise-grade analytics.

Continuous delivery without downtime
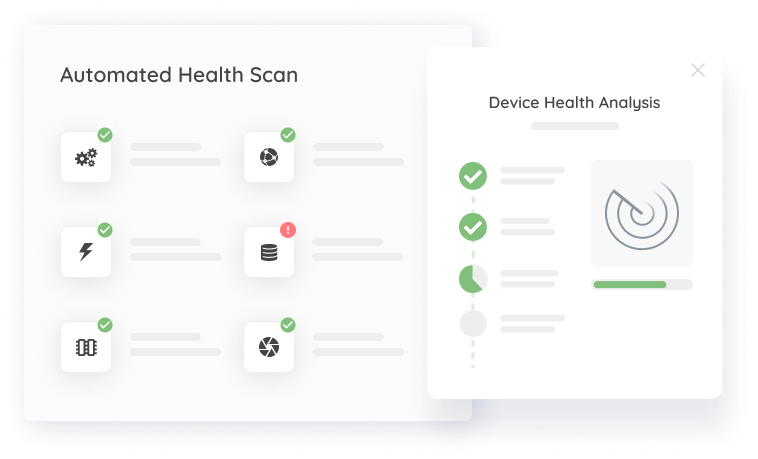
Ensure long-term performance with built-in tools for remote maintenance, health checks, and fast recovery.

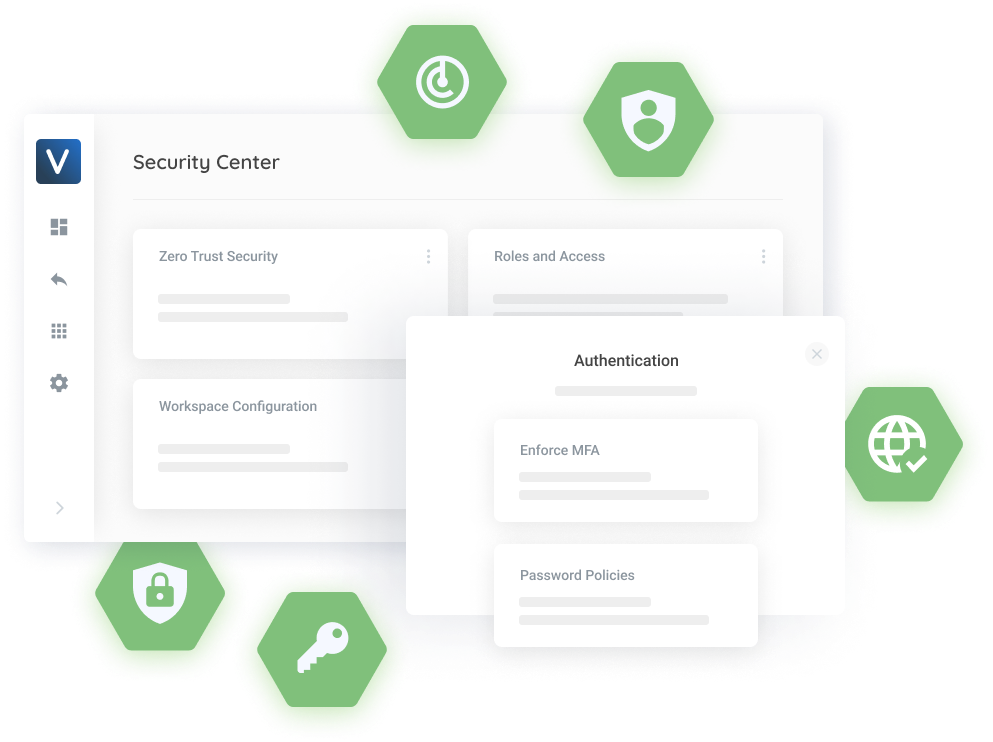
End-to-end protection by design
Viso Suite is built for enterprises with the most demanding security requirements—certified, encrypted, and hardened at every layer.

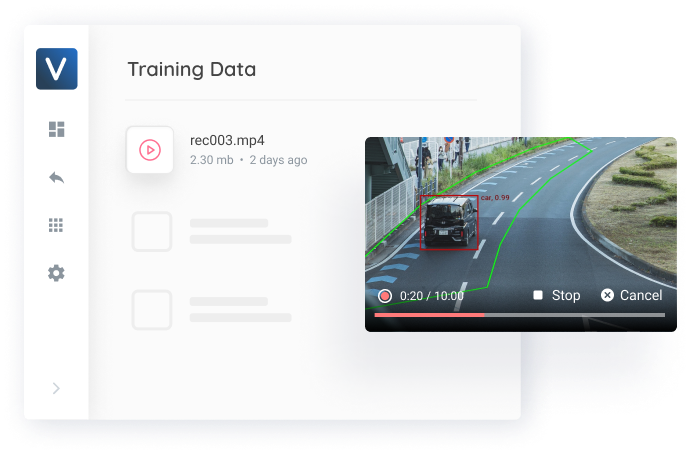
Collect data to train computer vision models
Capture training data
Record and store video data from one or multiple cameras with integrated capturing.Video data manager
Create new or import video data to the video data library. Manage all data in one place.Automated collection
Continuously gather data to improve AI models using automated, distributed data collection.Annotate image and video data
Scalable annotation
Comprehensive data labeling capabilities, including annotation workflow management.Dataset management
Create and manage datasets for computer vision model training, directly in the workspace.Collaborative annotation
A team of data annotators can safely annotate videos, guest access for external annotators.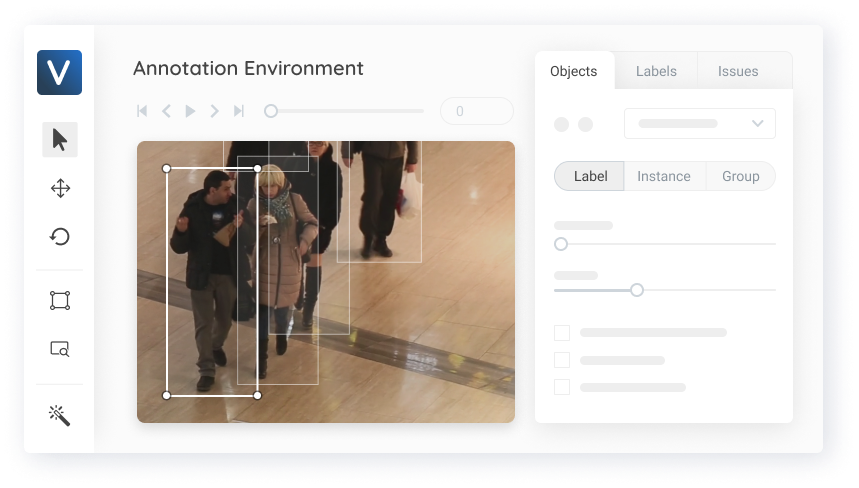
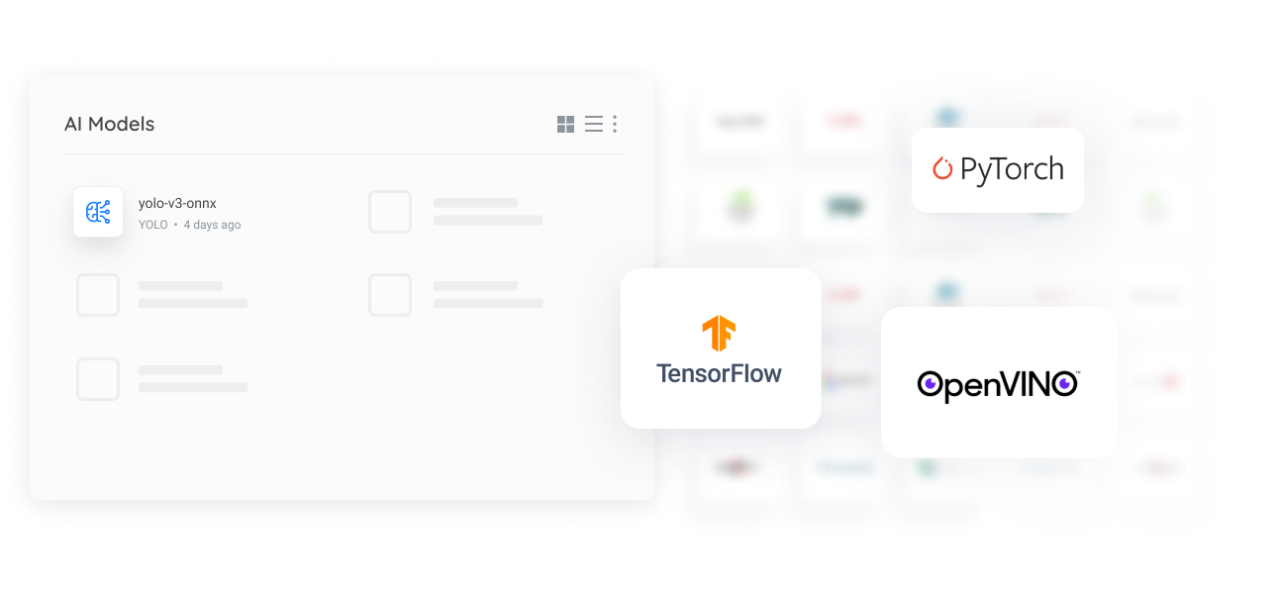
Train and manage custom AI models
Auto AI model training
Use one or multiple integrated environments to train custom computer vision algorithms.AI model manager
Manage all AI models across multiple ML framework, with built-in version control.Pre-trained models
Choose from an extensive library of integrated deep learning models, or import your own.Develop custom computer vision applications
Visual drag and drop
The visual editor makes it much faster and easier to create and maintain applications.Building block library
Use building blocks to integrate any camera, AI model, processing hardware and your systems.Application manager
Manage a portfolio of applications, keep updating them with built-in version control.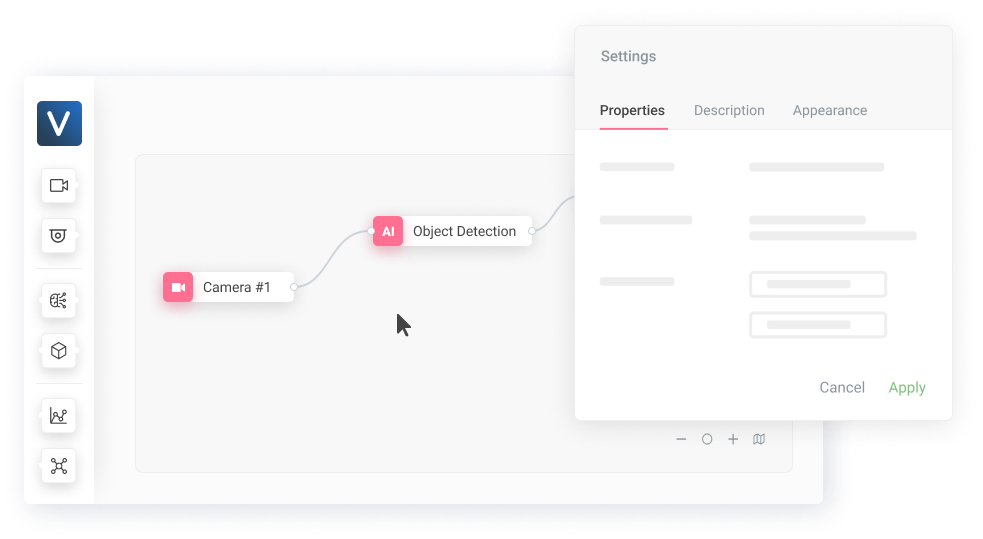
Deploy computer vision applications at scale
Device management
Easily enroll and manage physical and virtual edge computer – safely and fully automated.Distributed fleet
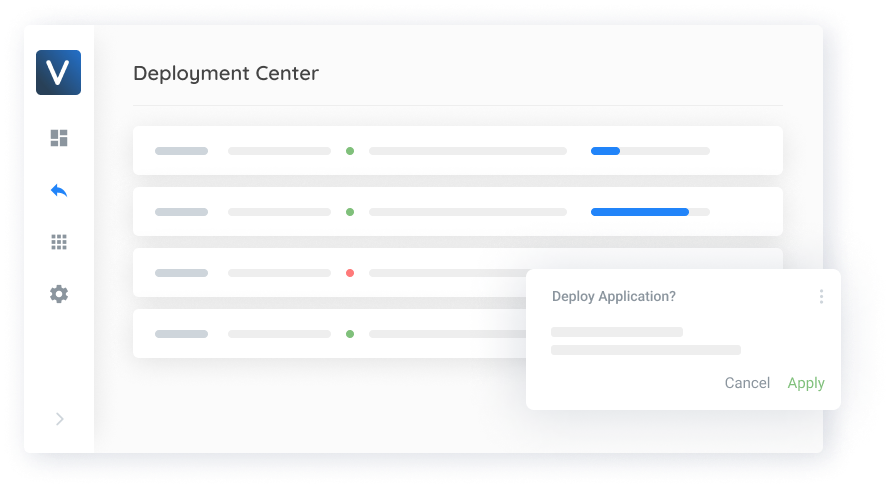
The automated collector agent provides IoT scale communication and offline capabilities.Automated deployment
Deploy applications using profiles, manage different releases and deploy with one click.Connect deployed applications and devices
IoT Edge Gateway
Integrated Edge Gateway manages and secures all Edge-Cloud connectivity and metrics.Configuration manager
Efficiently configure applications and manage individual configurations in the cloud.Private Edge AI processing
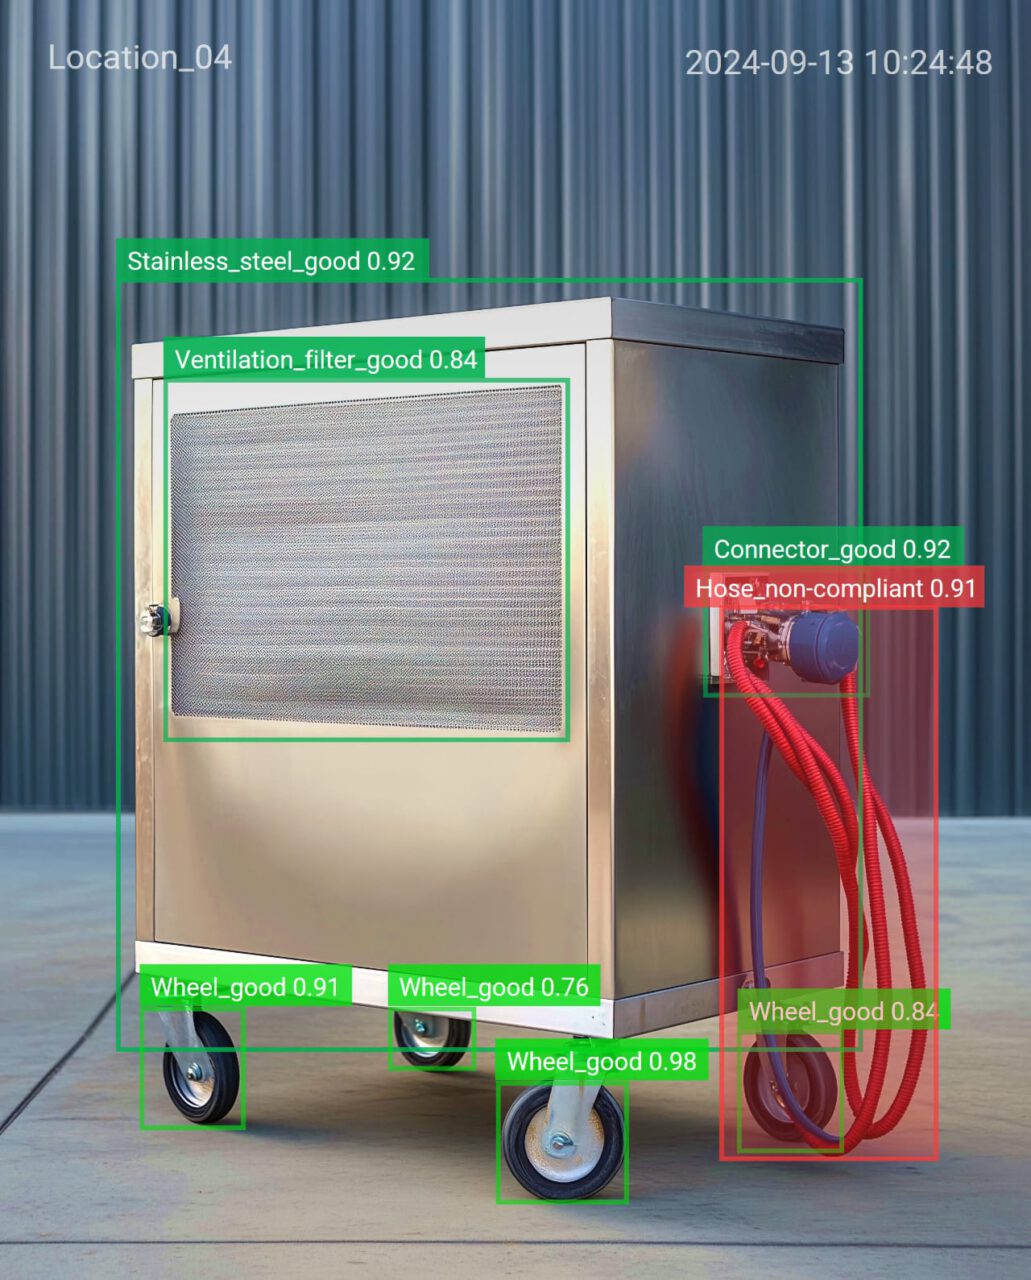
On-device machine learning analyzes all video data directly, without sending or storing video in the cloud.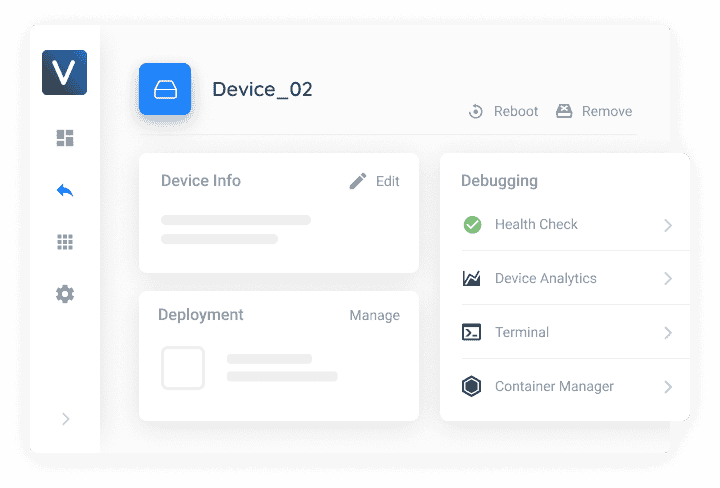
Monitor events and metrics in the cloud
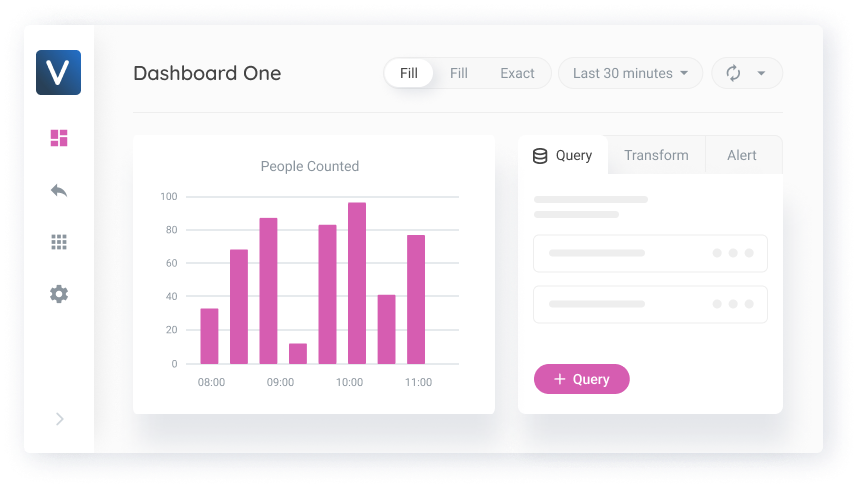
Real-time analytics
Visualize real-time and historical data and metrics from your applications.BI dashboard builder
Dashboard editor to create custom BI dashboards with +40 ready-made charts.Event monitoring
Aggregate data across all devices, use drill-down filters, explore data to identify events.Maintain all applications and ensure continuous delivery
Over-the-air updating
Manage application versions and roll out releases to different environments within a few clicks - no manual device flashing requiredAutomated diagnosis
Identify issues early with powerful diagnostic tools, system alerts, and auto health checks.Effective troubleshooting
Resolve issues with remote troubleshooting tools, fast rollbacks, and disaster recovery.