In fast-moving production and logistics environments, bottlenecks quietly drain performance. Whether it’s a backup of totes at a packing station, parts idling before inspection, or components stalled during assembly, queues can form rapidly. If not addressed, they ripple downstream, impacting throughput and labor efficiency.
Traditional systems track output but often miss what happens between steps. Most bottlenecks are detected only when performance drops or workers complain. By then, it’s too late to avoid the cost.
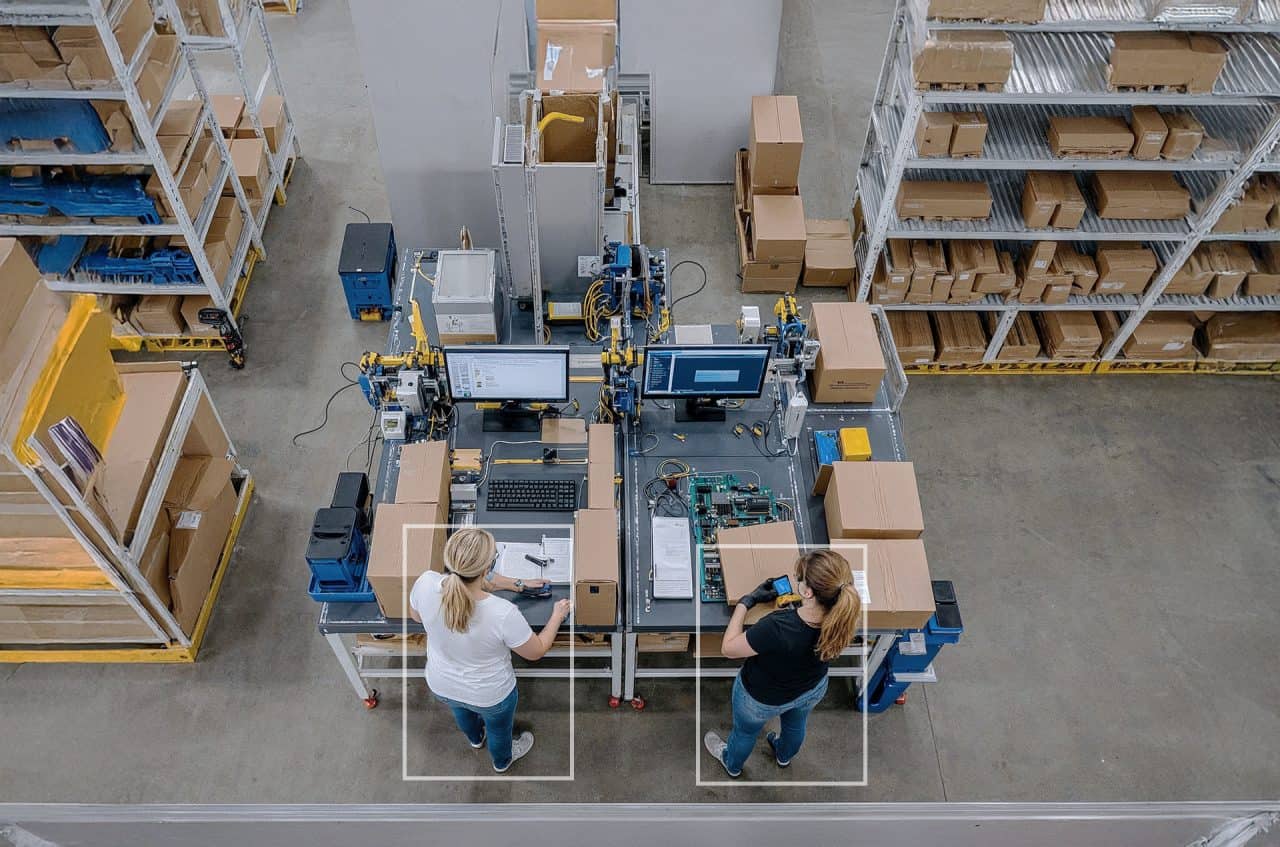
Process bottleneck identification uses computer vision to monitor real-time queue lengths and item wait times across critical stations. It provides the visibility needed to resolve slowdowns quickly, rebalance workloads, and support ongoing process improvement.
What the system measures
Live queue lengths and dwell times at stations, work cells, or material handoff points.
Computer vision models detect and count objects – such as parts, totes, or products – as they accumulate. The system monitors whether these items are flowing smoothly or building up beyond acceptable thresholds.
Key operational metric
Average objects waiting (queue length)
This metric reflects real-time station capacity performance and highlights areas where flow is impaired.
Detection value: ~$200 per item above capacity, due to added labor, WIP costs, floor space usage, and lost time.
How Process bottleneck identification works
Queue zone definition: Workstations are digitally mapped with expected capacity limits based on cycle time, layout, and takt.
Object tracking: Items entering and exiting each queue zone are detected and logged, capturing both count and time-in-queue.
Threshold alerting: When queue length or wait time exceeds configured limits, the system alerts supervisors or line leaders.
Trend analysis: All queue data is stored and visualized to support planning, Kaizen efforts, or layout adjustments.
This approach augments Marketing Execution Systems (MES) and production tracking tools with real-time, visual insights into actual material flow.
Industry use cases
- Electronics assembly: Detect Printed Circuit Board (PCB) buildup at solder inspection or final test.
- Automotive manufacturing: Identify Work-in-Progress (WIP) accumulation between interior trim and Quality Control (QC) stages.
- Food and beverage: Monitor product backups at wrapping or sealing stations.
- Logistics and distribution: Track tote queues before labeling or outbound loading zones.
Business benefits
- Prevent downstream delays: Detect and resolve slowdowns before they impact full-line performance.
- Improve takt time adherence: Align cycle times across stations by addressing mismatch in output rates.
- Reduce WIP and labor waste: Eliminate excess movement, handling, and waiting caused by queue congestion.
- Optimize resource allocation: Re-deploy labor or automation to support overburdened stations based on live data.
- Drive continuous improvement: Use queue analytics to support line balancing, SOP refinement, and lean initiatives.
Privacy and integration
Queue detection occurs locally on edge devices. No facial recognition or personal tracking is used – only object counts and timestamps. Data integrates easily with digital dashboards, MES, or lean management tools for cross-functional visibility.
Bringing bottlenecks into view
Most process delays go unseen until after throughput drops. Process bottleneck identification makes these inefficiencies visible, helping teams act immediately, instead of reacting after the fact.
It enables a shift from gut-feel management to real-time flow optimization, ensuring that production never stalls quietly in plain sight.
With continuous visibility into queue behavior, teams can maintain balance, protect output, and continuously improve process performance.