Accuracy prediction is important in any machine learning model process because it ensures that the model we created works properly and can be used with trust. The confusion matrix, precision, recall, and F1 score usually give a better intuition of prediction results as compared to accuracy.
This article will discuss the terms Confusion Matrix, Precision, Recall, Specificity, and F1 Score. The goal is to learn different ways to understand and analyze the machine learning performance with Python tools.
Confusion Matrix to Evaluate Model Performance
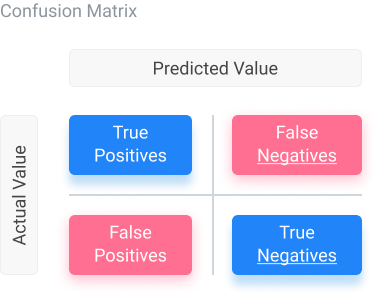
A confusion matrix is used to display parameters in a matrix format. It allows us to visualize true and false positives predicted, as well as true and false negatives.
To get the overall accuracy, we can subtract the total false positives and negatives from the total number of tests and divide that by the total number of tests. We can use a confusion matrix by importing it through the sklearn library. Scikit-learn (sklearn) in Python contains tools for machine learning and statistical modeling, including methods from classification to dimensionality reduction.
The following lines of code would import and implement a confusion matrix, with the assumption that y_pred and y_test have been initialized previously. In the following Python example, y_test and y_pred are variables that represent the test set and predicted values outputted by the machine learning model.
from sklearn.metrics import confusion_matrix
cm = confusion_matrix(y_test, y_pred)
print (cm)
Precision of a Machine Learning Model
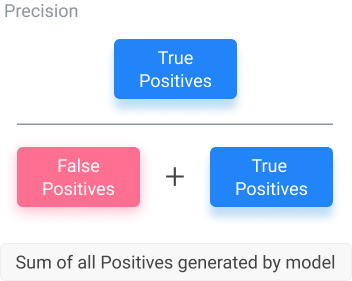
Precision is the percentage of positive instances out of the total predicted positive instances. It takes the total positives generated (true or not) in the denominator and the total true positives in the numerator. In the equation below, the denominator is the sum of the true positives and false positives, while the numerator is only the true positives. This equation lets us know how the number of correct predictions from the model is when it generates positive values.
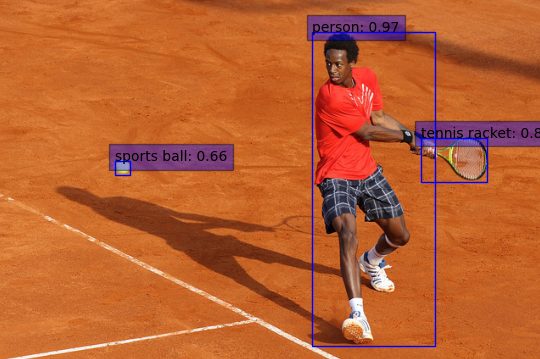
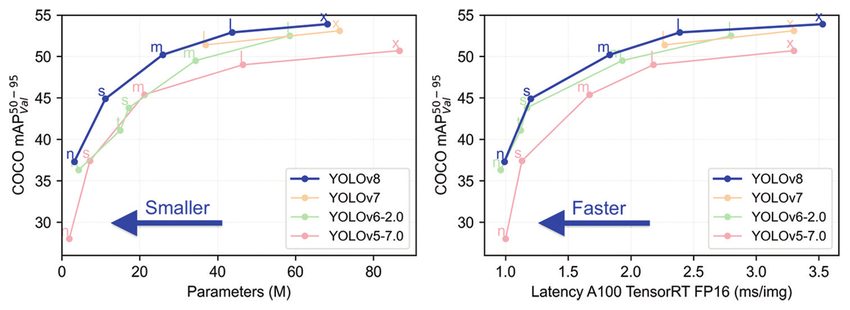
In the following table, you can see a comparison of YOLOv8 against other YOLO models. This table compares latency and parameters versus mean Average Precision (mAP), calculating average precision (AP) for each class and then the mean of these values across all classes. Average precision measures the area under the precision-recall curve, plotting precision (true positive rate) against recall (sensitivity) for different confidence thresholds in the predicted bounding boxes.
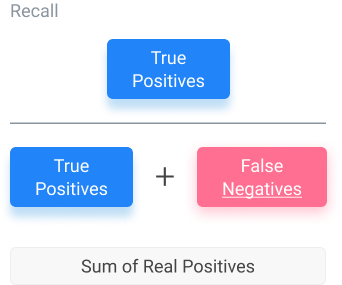
Recall or True Positive Rate
Recall encapsulates what the percentage of positive instances out of the total real positive instances is. In this case, the “positive instances” are the model-generated values. The “total real positive instances” are verified by test data. Because of this, the denominator will be the number of real positive instances present in the dataset (false negatives, true positives).
Instead of using the total number of positives generated by the model, like for the machine learning precision (above), we take the number of positives known according to verified data. This equation lets us know how many extra positives the model declared when it was supposed to be negative.
Specificity of Machine Learning Models
Specificity entails the percentage of negative instances out of the total actual negative instances. It is similar to the true positive rate method above. Here, the denominator is the sum of real numbers not generated by the model but instead verified by data points. Because the numerator is the number of true negatives, this equation allows us to see how often the model is correct when it generates negative outputs based on the true negatives of the total negatives it produced in the past.
F1 Score to Analyze Machine Learning Models
F1 score is when we take the mean of precision and recall. It takes both contributions, meaning that the higher the F1 score, the more accurate the model. Conversely, if the product in the numerator dips too low, the final F1 score decreases dramatically.
A model with a good F1 score has the most drastic ratio of “true: false” positives as well as the most drastic “true: false” negatives ratio. For example, if the number of true positives to the number of false positives is 100:1, that will play a role in producing a good F1 score. Meanwhile, having a close ratio, say 50:51 true to false positives, will produce a low F1 score. The equation for the F1 score is below.
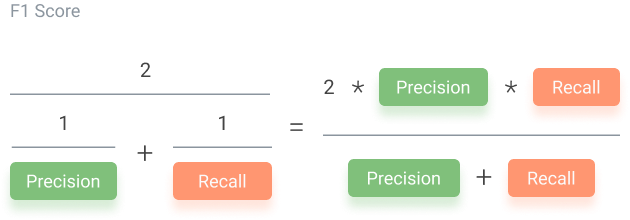
An F1 score is considered perfect when it’s 1, while the model is a total failure when it’s 0. Thus, a low F1 score is an indication of both poor precision and recall.
What’s Next for Analyzing Machine Learning Model Performance?
These are just the most important techniques for machine learning model performance evaluation. However, there are many more acceptable approaches to calculating performance. These include determining the area under the ROC curve (Receiver Operating Characteristic) and precision-recall curves, which are implemented programmatically.
If you liked this article on model development and model evaluation, we recommend the following: