
Model accuracy is a well-known metric to gauge a model’s predictive power. However, it can be misleading and cause disastrous consequences. Here is where precision vs recall comes in.
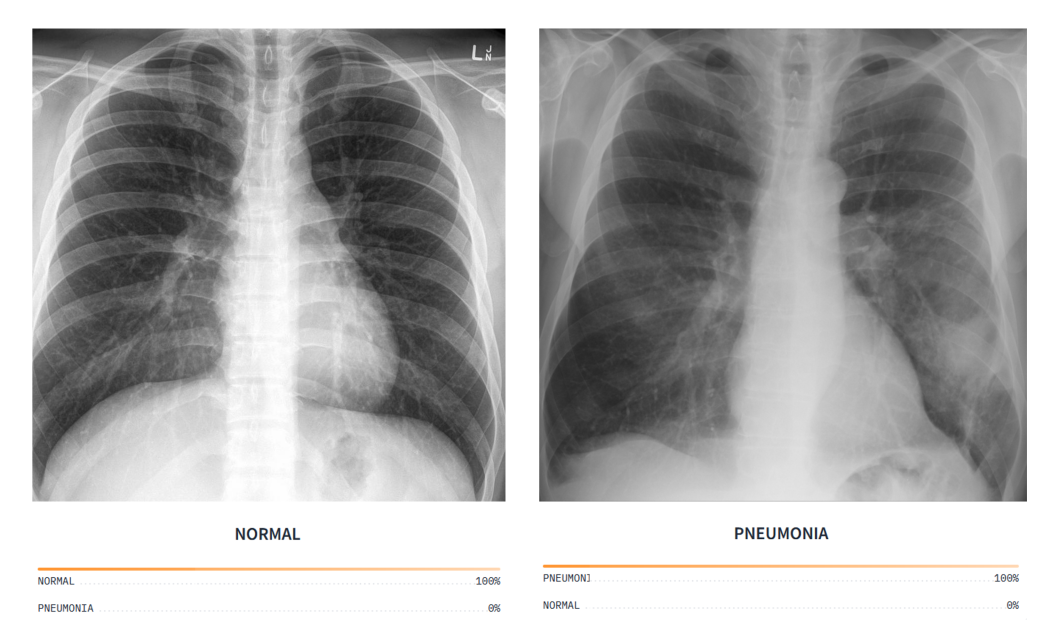
Imagine a computer vision (CV) model for diagnosing cancerous tumors with 99% accuracy. While the model’s performance seems impressive, it is still likely to miss 1% of tumor cases, leading to severe complications for specific patients.
This is why we need a toolset of methods to understand better and analyze model performance. Recall vs precision are two valuable metrics that allow for better model evaluation. Both also serve as the foundation for deriving other essential metrics, such as the F1 score and the ROC-AUC metric.
What is Accuracy?
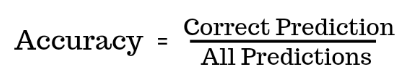
Accuracy measures how often a model predicts the outcome correctly relative to the total number of predictions. The metric has widespread use for measuring model performance in computer vision tasks, including classification, object detection, and segmentation.
While accuracy is intuitive and easy to implement, it is only suitable for scenarios where the training and validation datasets are relatively balanced. For skewed datasets, accuracy scores can be unrealistically high.
For example, a CV model for classifying cats can have 95% accuracy if the training dataset consists of 95 cat images and only 5 dog images. The reason is the model can keep classifying every image as a cat and still be right 95% of the time since the dataset has very few dog images.
A better measure should recognize these prediction inconsistencies and highlight the number of incorrect predictions to guide the model-building process correctly.
That’s where precision and recall come into play. However, let’s first discuss the key concepts before understanding how precision and recall work.

The Confusion Matrix
A confusion matrix is a table that provides a detailed breakdown of the model’s predictions by comparing its output to the actual targets. It visually represents the number of correct and incorrect predictions across all classes in positive and negative assignments.
The correct predictions in a confusion matrix are called true positives (TP) and true negatives (TN). For instance, in our cat classification model, true positives are cat images that the model correctly labels as “cat,” and true negatives are dog images that the model correctly identifies as “dog” or “not cat.”
The incorrect predictions are called false positives (FP) and false negatives (FN). For example, false positives would be dog images predicted as cats, and false negatives would be cat images predicted as dogs.
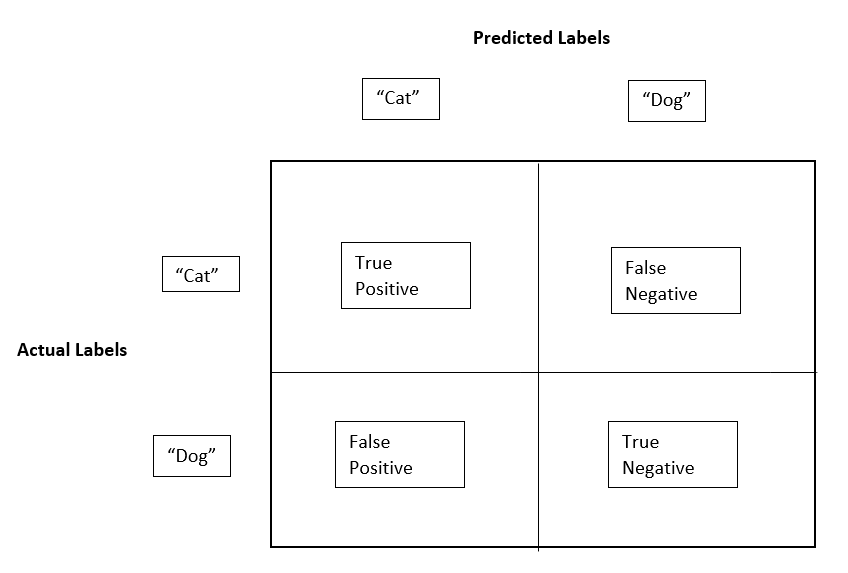
Confusion matrices are essential for calculating precision and recall, which are important metrics for assessing the quality of the classification model.
Precision vs. Recall
The confusion matrix forms the basis for calculating the precision and recall metrics. The following explains the two methods in detail.
Precision
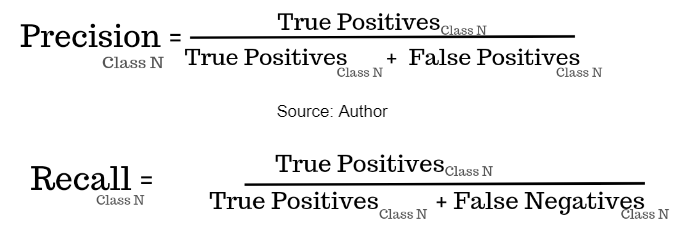
Precision is a metric that measures the proportion of true positives (correct predictions) against the model’s total positive predictions. The formula below summarizes the concept.
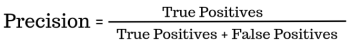
The precision metric is important because it focuses on the number of true positives, which are the correct predictions of the positive class.
Precision is suitable in cases where false positives are costly. For instance, a recommendation system that flags unsafe videos for kids should have high precision. The model should not classify unsafe videos (true negatives) as safe (false positives). In this case, the model will be acceptable even if it flags most safe videos as unsafe.
However, precision is not suitable where you want to minimize false negatives. So, in the example highlighted earlier, a tumor detection model would not be acceptable if it has lower false positives (high precision) but misclassifies many actual tumor cases as normal (false negatives).
Recall
Recall, also known as sensitivity or true positive rate, is a metric that measures the proportion of true positives correctly identified by a model.
It measures the number of correct class predictions relative to the number of samples in the corresponding class. For instance, out of 95 cat images, how many cats did the model predict correctly?
The formula below illustrates the concept.
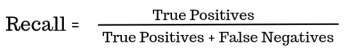
Unlike accuracy, which calculates the overall rate of correct predictions, recall zooms in on avoiding false negatives.
The recall metric is vital in ML use cases where missing true positive instances can have significant consequences. For example, an acceptable tumor detection model will have high recall – it will predict most cases as tumorous (high false positives), but will not label a cancerous tumor as normal (false negative).

Precision vs. Recall Trade-off
From the definition of both precision and recall, we can see an inherent trade-off between the two metrics. For instance, a robust tumor detection model can have high recall, but low precision, since the model will predict almost every case as tumorous (high false positives).
In contrast, the recommendation model for flagging unsafe videos can have low recall but high precision, as it will predict almost every video as unsafe (high false negatives).
As such, using precision and recall in isolation does not provide the complete picture. You must use them together and select a model that gives an optimal result for both.
F1 Score, Precision-Recall Curve, and ROC-AUC
The F1 score, precision-recall curve, and receiver operating characteristic (ROC) curve are helpful measures that allow you to select a model with suitable precision and recall scores.
F1 Score
The F1 score is the harmonic mean of precision and recall scores. The formula below illustrates the concept.
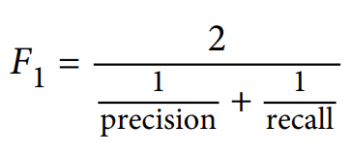
As the formula shows, the F1 score gives equal weightage to precision and recall. So, a model with 70% precision and 50% recall will have an overall F1 score of 58%. You can compare the F1 scores of multiple models to judge which is the most optimal.
Precision-Recall Curve
Precision and recall scores can change with different thresholds. The threshold is the minimum probability for categorizing a prediction as positive. For a cat classification model, a threshold of 0.5 means the model will label an image as a cat (positive) if the prediction probability is greater than or equal to 0.5.
In general, setting a higher threshold can lead the model to have higher precision but low recall. For instance, a threshold of 0.8 would mean the model has to be 80% confident that the image is a cat to label it as a “cat.”
Raising the threshold to 0.7 means the model will label an image as a cat only if the prediction probability is greater than or equal to 0.7.
However, most images may have lower prediction probabilities, causing the model to classify several cat images as dogs (high false negatives), leading to a lower recall. The diagram below shows how precision and recall may vary with different threshold values.
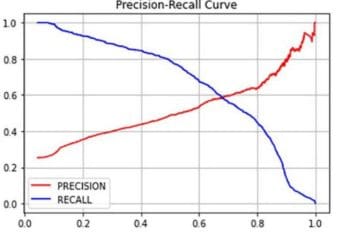
Visualizing the precision and recall trade-off together with different threshold values is helpful. The diagram below illustrates the precision-recall curve based on the graph above.
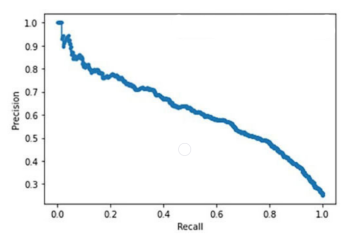
Here, recall falls almost linearly with precision. You can use this to select a suitable precision-recall score for your project. For instance, you will likely want high recall for the tumor recognition system (low false negatives).
Let’s say you want a recall score of 90%. This means your precision score will be roughly 40%.
Based on this, you can configure the threshold value as 0.2 by looking at the graph above. In this case, the model will classify a case as tumorous even if there is a 20% probability that a tumor is present.
However, you can develop another model with a better precision-recall trade-off. Such a model’s precision-recall curve will be further to the top-right corner.
ROC Curve and AUC
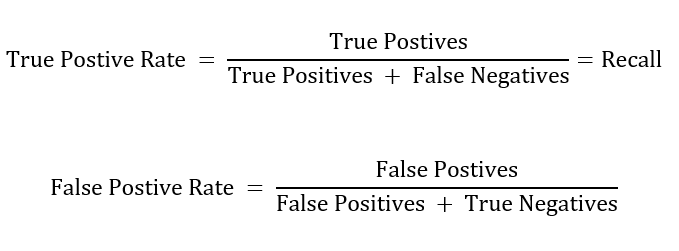
Another valuable visualization is the ROC curve. Similar to the PR curve, it illustrates the trade-off between the true positive rate (recall) and the false positive rate at different classification thresholds. The following shows the calculation for true and false positive rates.
The diagram below shows the ROC for a particular model against several threshold values.
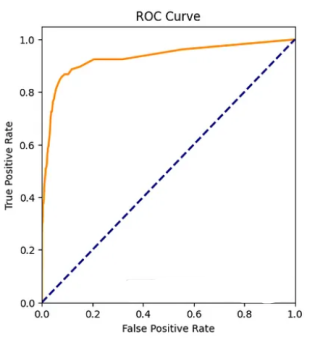
Again, the diagram highlights the trade-off – high recall means a high false positive rate, which implies lower precision.
Increasing recall (high true positive rate) for the tumor classification model means capturing as many actual tumorous cases as possible. However, this may lead to low precision (high false positive rate) as the model will classify many non-tumorous cases as tumorous.
Selecting a model based on ROC requires you to compute the area under the curve (AUC). A completely random model with no predictive power will have an AUC score of 0.5 – the area of the triangle formed by the diagonal dotted line in the image – and a perfect model will have an AUC score of 1 – the orange line will be further to the left.
Multi-Class Precision-Recall
So far, the definitions we looked for Precision and Recall are for binary classifications – models that only distinguish between two classes. However, you can use the two metrics for multi-class classifications.
Since multiple classes exist in multi-class models, we can compute precision and recall scores for each class as follows.
However, precision and recall scores for each class do not help assess a model’s overall performance. A model having fifty classes will have fifty precision and recall scores. Judging the model’s predictive power from these will be challenging.
The solution is to use two methods, called micro and macro averaging, that combine the precision and recall scores for each class to provide an aggregate metric for evaluation.
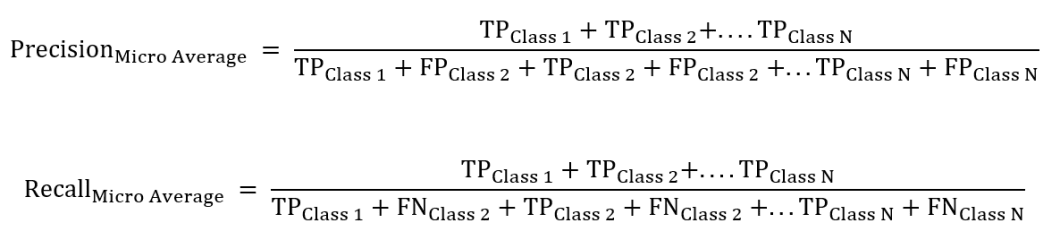
Micro Averaging
Micro averaging aggregates the true positives, false positives, and false negatives across all classes and then calculates precision and recall based on the aggregate value. The micro average gives equal weight to each instance from each class. The following illustrates the formula.
While microaveraging addresses classification for each instance, it can be misleading for skewed datasets.
For instance, consider two classes – Class 1 and Class 2, where Class 1 has 95 samples, and Class 2 has 5 samples.
A model that classifies all samples for Class 1 correctly but misclassifies all for Class 2 will have high precision and recall scores based on micro averages. In such scenarios, it is more appropriate to use macro-average.
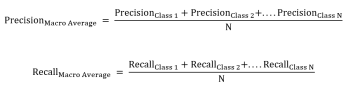
Macro Averaging
Macro averaging calculates precision and recall for each class separately and then takes the average across all classes. Macro-averaging gives equal weight to each class, as the formula below illustrates,
Considering the same example as above, Class 2’s precision and recall scores will be low, causing macro averages to be low.
Precision vs Recall: Use Cases
As highlighted earlier, choosing between recall and precision requires prioritization as favoring one metric causes the other to fall. Let’s see a few CV use cases to help you decide between the two.
Medical Diagnosis
In medical diagnosis, missing even one case can have devastating consequences. CV models for analyzing medical images should generally have high recall for correctly classifying as many true positives as possible, even if it leads to some false positives or high precision.
Security Systems
Security systems involve flagging anomalous behavior to alert authorities regarding potential threats. Again, high recall is desirable as capturing as many suspects as possible (high false positives) is better than missing actual culprits.

Quality Assurance
In manufacturing, CV models help detect defective products in production so they do not reach the customer. These models should have high recall since classifying a faulty product as normal (high false positive) can cost a company its customers if they get defective items.
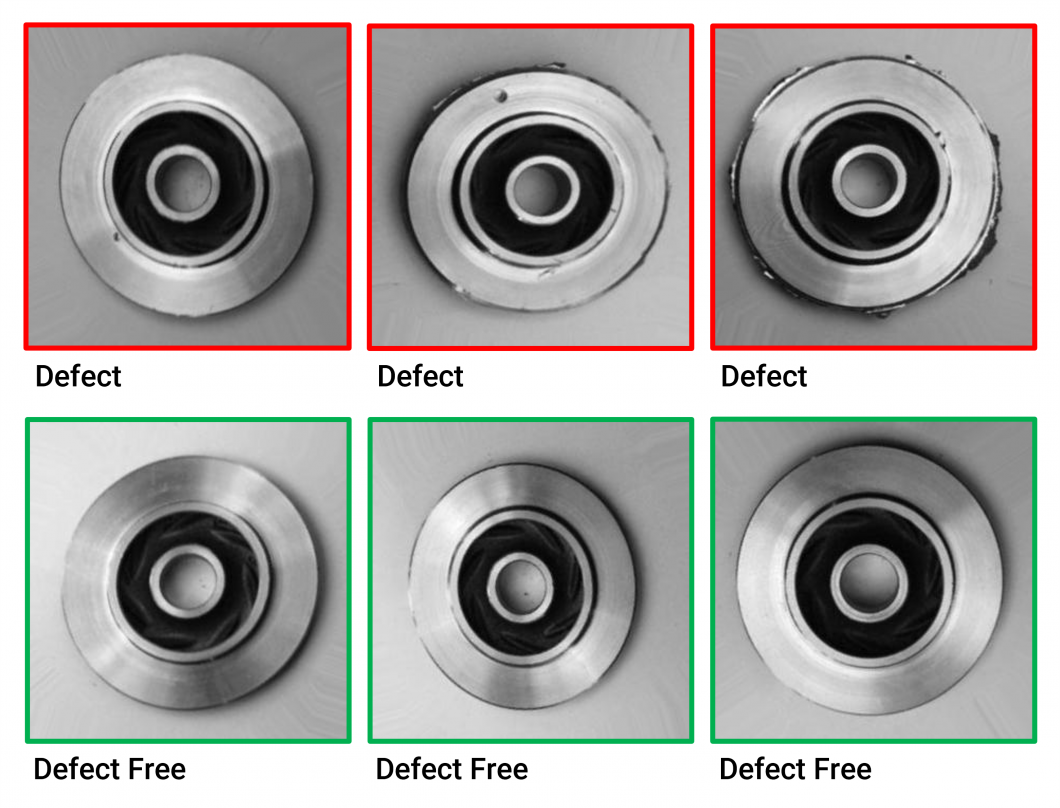
Image Retrieval Systems
CV models for image retrieval analyze a user’s search query to fetch images that match the query’s description. Having a model with high precision (low false positives) is crucial for producing relevant results and ensuring users easily find what they are searching for.
Facial Recognition
Devices using facial recognition models to authenticate users should have high precision (low false positives) to minimize unauthorized access.

Overall, the choice between recall and precision is context-specific and based on the consequences that false positives or false negatives can cause.
Precision vs. Recall: Key Takeaways
Precision vs. recall machine learning metrics are vital for assessing a model’s predictive performance. Below are a few critical points to remember regarding these two measures.
- Precision and recall are desirable for skewed datasets: While accuracy is appropriate for balanced datasets, precision and recall offer a better evaluation for models trained on imbalanced data.
- Precision and recall trade-off: Increasing precision leads to low recall and vice versa. You should choose a model with optimal precision and recall based on the F1 score, PR curve, and ROC-AUC.
- Multi-class precision and recall: Macro and micro-averaging are two methods for computing precision and recall for multi-class classification models.
You can read more about related topics in the following blogs:
- CV Model Evaluation Methods
- Interaction over Union (IoU) for Object Detection
- CV applications in manufacturing
- CV applications in security and surveillance