In lean manufacturing environments, it’s often the small, unmeasured inefficiencies that erode output over time. While machine failures and staffing shortages are easy to spot, one of the most pervasive and overlooked sources of productivity loss is idle time at workstations.
Idle workstations, whether due to material delays, unclear instructions, under-scheduling, or downtime between processes, can significantly undercut Overall Equipment Effectiveness (OEE). Even when equipment is operational and staffed, idle time quietly accumulates in the background, inflating takt time, creating bottlenecks, and ultimately diminishing throughput.
Yet for many facilities, idle time is difficult to track accurately, and even harder to resolve. Manual observation is sporadic and often influenced by recall bias or inconsistent documentation. Traditional tools like OEE dashboards focus on machine uptime but offer little visibility into how long stations remain unused throughout the day.
![]()
A vision-based approach to idle time
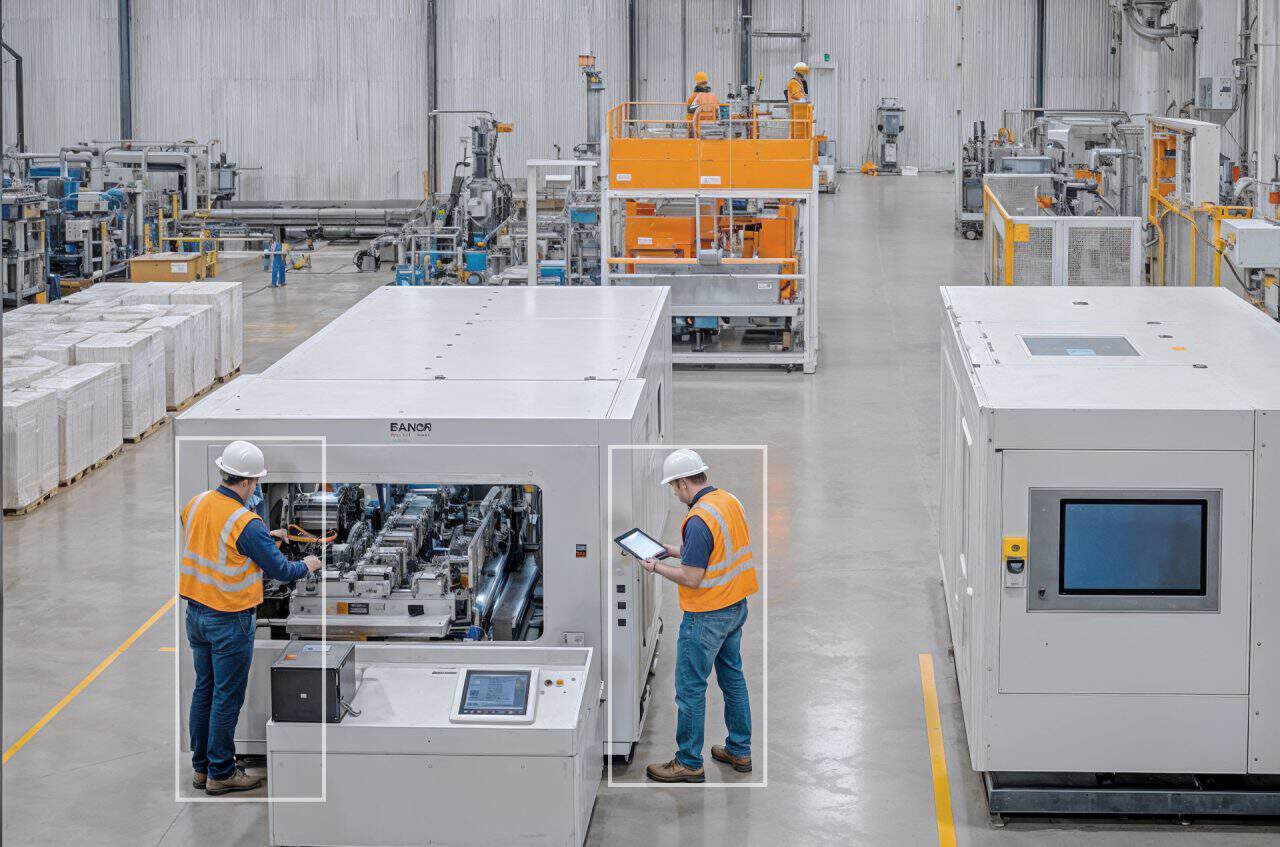
Work/Idle Workstation Logging uses AI-powered computer vision to continuously monitor workstation activity across the shop floor. Instead of relying on input from operators or machinery alone, the system passively observes workstations in real time, logging when stations are actively being used versus when they are idle.
This passive, camera-based approach allows teams to:
- Quantify exactly how much idle time occurs each shift
- Identify recurring patterns of underutilization
- Isolate causes of downtime at the workstation level
- Improve scheduling, resourcing, and line balancing
And because it uses existing camera infrastructure and edge processing, deployment is fast and unobtrusive, without requiring sensors or integration with machine PLCs.
What the system tracks
The system detects physical activity, or lack thereof, at defined fixed stations, work cells, or machines.
Using vision models trained to distinguish between active work (operator presence, hand/tool motion, part movement) and inactivity, the system classifies each workstation’s status in real time. This classification is recorded at regular intervals and logged to show patterns across:
- Hourly and daily idle minutes
- Idle time by shift or team
- Trends across different production days
- Common timing of delays (i.e., at shift change or near lunch breaks)
All data is anonymized and stored securely at the edge, ensuring full compliance with data privacy and workforce monitoring policies.
Key operational metric
Idle minutes per day
The primary metric generated is Idle Minutes/Day, a direct measurement of time where fixed assets or stations were staffed but not productive.
Even modest improvements can yield high returns. I.e., if a single station is idle for 45 minutes per shift, that equates to a loss of $450/day per station (based on $10/minute in lost productivity). Across multiple stations and lines, the cumulative effect becomes significant.
By establishing idle time as a quantifiable metric, operations leaders can benchmark station efficiency, compare line performance, and drive focused improvements.
How it works
- Station configuration: Designate and map each fixed workstation or equipment zone to be monitored. These can include manual assembly stations, packing lines, inspection cells, or robotic equipment areas.
- Activity detection: Computer vision models detect human presence, tool usage, motion, or material interaction in the workstation zone. If no activity is detected over a configurable time threshold, the station is marked as idle.
- Time logging: Each station’s status (active or idle) is recorded continuously. At the end of each shift or defined interval, reports show idle minutes, frequency of idle events, and duration patterns.
- Alerts and analysis: If idle time exceeds a preset threshold, supervisors can be alerted to investigate, allowing timely intervention during the shift rather than after the fact.
Use cases across industry
Automotive and heavy assembly: Track idle time at manual subassembly stations to identify upstream delays or misaligned takt times.
Electronics and consumer goods: Measure activity at inspection or testing stations to uncover bottlenecks that result in wasted labor.
Packaging and fulfillment: Monitor hand-pack stations or labeling zones to reduce idle time during slowdowns or supply gaps.
Metal fabrication and machining: Log inactivity at CNC machines or welding booths that may reflect scheduling gaps or prep-time issues.
![]()
Business benefits of Work/Idle Logging
Boost OEE without capital investment
Unlock productivity from existing assets by reducing non-productive time, rather than adding equipment.
Find and fix line imbalances
Use idle time trends to realign station cycle times and reduce upstream or downstream starvation.
Support labor planning and staffing
Identify stations that are consistently over- or under-resourced, improving task assignments and shift structure.
Enable continuous improvement
Track idle time before and after process changes to measure impact and drive lean performance gains.
Enhance visibility for supervisors
Enable real-time dashboards showing current workstation status across the facility, helping supervisors respond proactively.
Seamless integrations and privacy
The system operates on existing camera feeds and edge infrastructure, logging only activity status, not identity or video. This makes it easy to deploy in sensitive environments without disrupting workforce dynamics.
Data can be exported to OEE platforms, MES systems, or lean dashboards to provide holistic visibility into productivity trends.
From blind spots to actionable efficiency
Idle time is one of the most pervasive forms of manufacturing waste, but it’s often hidden in plain sight. Work/Idle Workstation Logging turns a qualitative blind spot into a measurable, actionable metric.
With continuous visibility into how your stations are performing, your team can move from reactive observation to proactive optimization: increasing productivity, reducing cost per unit, and maximizing the value of your workforce and equipment.