• Train

          Develop

          Deploy

          Operate

          Data Collection

          Building Blocks​

          Device Enrollment

          Monitoring Dashboards

          Video Annotation​

          Application Editor​

          Device Management

          Remote Maintenance

          Model Training

          Application Library

          Deployment Manager

          Unified Security Center

          AI Model Library

          Configuration Manager

          IoT Edge Gateway

          Privacy-preserving AI

          Ready to get started?

          Overview
          Whitepaper
          Expert Services
  • Services
        • Resources

          Research

          Company

          Why Viso Suite?

          The Viso Blog

          About Viso

          Evaluation Guide

          Explore Use Cases

          Customers

          Viso Suite Whitepaper

          Industry Reports

          Support Center

          ROI Impact Study

          Technology Guides

          Careers

          Security & Trust

          Contact

          Why Viso Suite

          Viso Suite is the most advanced no-code computer vision platform to build, deploy and scale your applications. It is trusted by leading Fortune Global companies.

  • Pricing
Viso Suite
Evaluation Guide

Can I Build Reports and Dashboards With Viso Suite

Table of Contents

Yes. Viso Suite provides advanced built-in BI tools to build reports and dashboards to visualize data from your computer vision applications.

Create Custom Analysis Dashboards

Teams can leverage the integrated dashboard builder and analytics visualization tools to gather custom application metrics that are useful and easy to interpret. Viso Suite provides a fully managed time-series database that is optimized for time-stamped data.

The Viso Suite applications send real-time data to a fully managed time-series database. Event-driven computer vision applications send specific event data from the edge to the cloud, utilizing integrated and secure data connectors. With Viso Dashboards, events can be tracked, monitored, down sampled, and aggregated over time and across groups of endpoints.

Visualization Capabilities

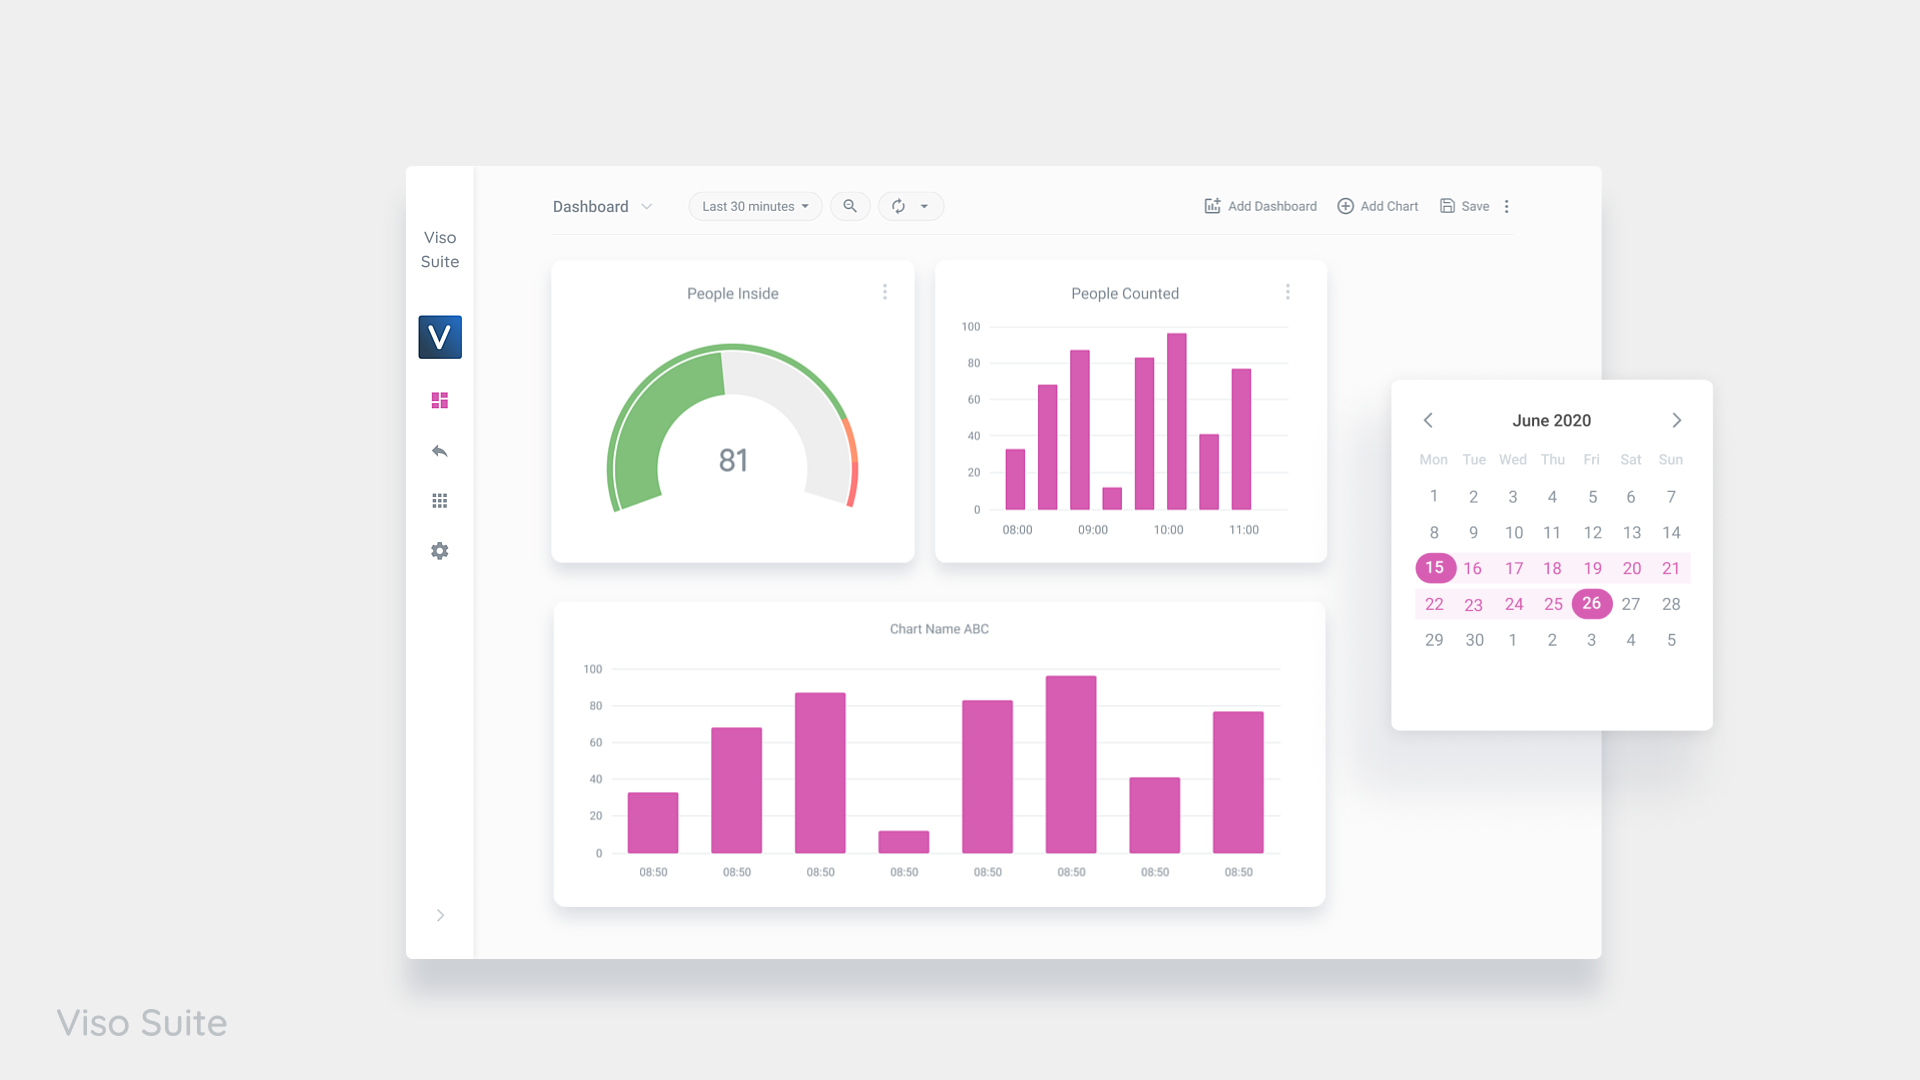
Using the integrated dashboard builder of Viso Suite, the charting widgets can be placed and resized with drag and drop. Use intuitive and interactive charts to create custom dashboards and reports:

  • Extensive set of charting widgets that work out-of-the-box
  • Visual data aggregation across all endpoints
  • Real-time dashboards with dynamic drill-down filters

You can query the underlying database or send the event data to an external database. This allows using your own business intelligence or data reporting toolsets.

Overview

Viso is the only high-productivity computer vision platform for low-code app development that provides a comprehensive and integrated set of tools and services for managing the entire app lifecycle.

Play Video