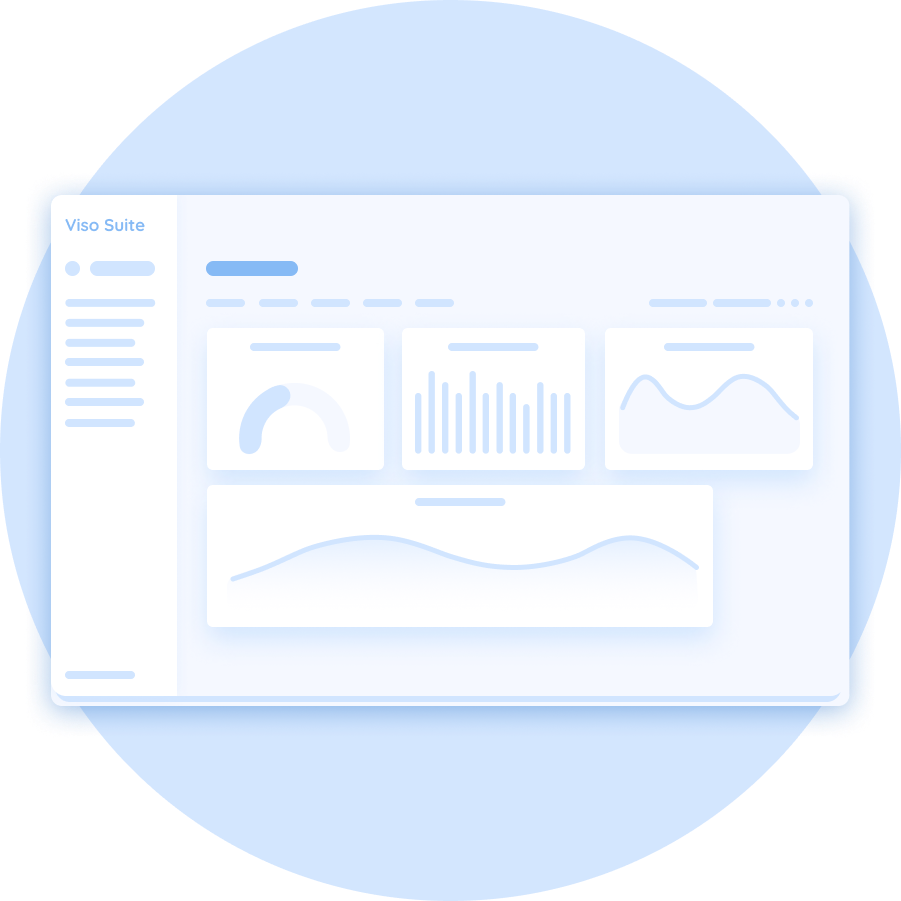
Comprehensive auditing and monitoring tools built into Viso Suite enable proactive management of application performance and make it easier to detect issues in real-time. Viso Suite provides dashboard tools to monitor events and metrics in the cloud.
All information and endpoint metrics are provided by default without any extra work and without introducing any overhead to the systems. Lower-level monitoring and management of application or edge device/server resources, such as CPU, network stats, and the disk, can be performed with built-in system monitoring tools. There is no need to install and maintain underlying technologies for edge endpoint management when using Viso Suite.
Performance monitoring systems
Detailed endpoint hardware performance monitoring is critical for operating computer vision systems. Viso Suite provides rich performance monitoring dashboards that make it easy to understand performance bottlenecks and take action. The analytics tools are optimized to maintain and observe distributed systems with numerous edge endpoints that each can be temporarily offline. Teams can drill down to any level of granularity and filter real-time and historical data aggregated across large fleets of endpoints.
The dashboard also automatically surfaces issues that a team may not be aware of, such as slow network connections or poor resource management. This reduces the time it takes to resolve them, so teams can focus on creating new applications and features, not troubleshooting them.
Endpoint monitoring and alerting
With the endpoint infrastructure management dashboard, it’s possible to explore how the device and network performance are affecting the computer vision applications. The performance analysis provides historical data of a broad set of metrics with sophisticated drill-down capabilities to detect issues early and optimize the AI vision applications.
No extra frameworks need to be enabled or developed to take those measures. The monitoring includes metric-based analysis of
- Resources, including CPU and RAM or GPU usage, disk and storage availability
- Network, where they can check the network bandwidth over time, network stability, and download speed
- Server, where they can check for slow database queries and slow container communication