Geospatial Intelligence (GEOINT) is a discipline that focuses on the collection, analysis, and interpretation of Earth’s imagery and geospatial data. It aims to describe, evaluate, and depict the characteristics of the Earth’s physical features and the activities referenced to a geographic location. GEOspatial INTelligence plays a pivotal role in helping authorities and urban planners make informed decisions on infrastructure development, traffic management, and resource allocation.
When we integrate computer vision algorithms with geospatial intelligence, it helps automate large volumes of spatial data analysis. The computer vision or AI-powered GEOINT models provide faster and more accurate insights than traditional ones. This integration allows for proactive solutions to issues like traffic congestion, land use, and disaster preparedness, ultimately leading to smarter, more sustainable cities.
In this article, you’ll learn:
- What is AI Geospatial Intelligence?
- Use Cases
- AI Technologies for Geospatial Analysis (AI urban planning tools like GIS, machine learning models, and computer vision for
- urban analysis)
- Steps to Build an AI Geospatial-Intelligence System
- Tutorial for Building a Traffic Flow Prediction Model
- Challenges and Future Trends in AI GEOINT Research
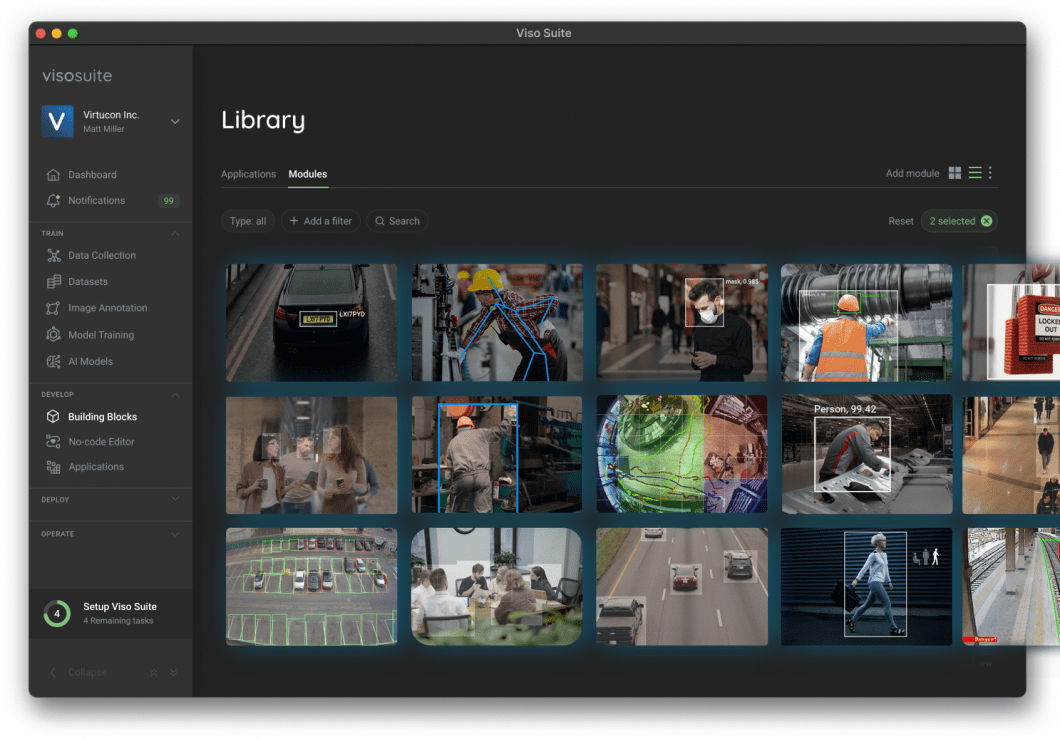
About us: Viso Suite makes it possible for teams to rapidly build, deploy, and scale computer vision applications. Organizations can securely process video at the edge and manage deployments across a wide range of use cases, including smart cities and urban planning. To learn more about the value of using Viso Suite in smart city applications, book a demo with our team of experts.
What is Geospatial Intelligence?
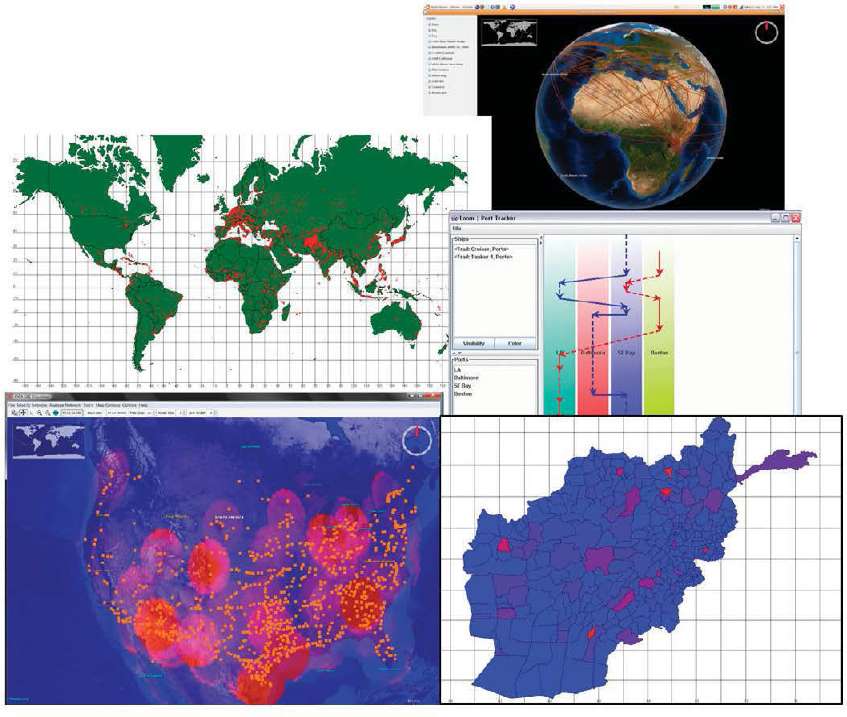
Geospatial Intelligence, or GEOINT for short, is the collection, analysis, and interpretation of geographic information from various sources such as satellite imagery, drones, GPS data, and maps. It integrates spatial data with advanced technologies like AI and machine learning to discern insight into geographic patterns, trends, and human activities. GEOINT sees broad applications across industries for decision-making and strategic operations: from defense to urban planning, disaster management, and environmental monitoring.
AI geospatial intelligence helps city planners and infrastructure development authorities in:
- Predicting Traffic Patterns
- Optimizing Urban Infrastructure
- Monitoring Environmental Changes
- Improving Land Use
Use cases of AI GEOINT
Traffic management
A traffic management system is one of the most active applications of AI geospatial intelligence. Analyzing traffic data from cameras at traffic junctions, GPS devices, and sensors will enable an AI-based GEOINT system to predict traffic congestion and adjust routes in real-time.
Infrastructure development
Geospatial intelligence is used by urban planners to identify the best sites for new infrastructure, such as highways, public transportation routes, or commercial developments. From demographic data along with land use information and present congestion patterns, artificial intelligence can used to create GEOINT models that can suggest points where new infrastructure would be valid. As Artificial intelligence (AI) becomes more integrated with GIS (geographic information system), planners can introduce different future development scenarios, estimate the costs involved, and assess the long term environmental implications.
Disaster preparedness
Geospatial intelligence plays an important role in disaster management in terms of predicting the areas likely to be exposed to disaster events. It also helps with situational awareness of disaster events. AI models use the data on flooding, earthquakes, or any other natural disasters to identify risk-prone areas. Real-time geospatial data is used to plan evacuation routes, allocate emergency resources, and observe the progress of recovery processes in an emergency.
AI technologies for geospatial analysis
AI technologies have transformed the field of geospatial analysis. By combining Geographic Information Systems (GIS) with machine learning, computer vision, and data analytics, the GEOINT systems can rapidly analyze urban data.
Some of the most effective AI technologies in geospatial analysis include the following:
Geographic Information Systems (GIS)
A geographic information system (GIS) is a foundational technology in geospatial intelligence. It is a computer system that is responsible for capturing, storing, analyzing, and displaying spatial and geographically referenced information. A vast amount of spatial data is now manageable by traditional GIS systems, but when those are coupled with AI algorithms, their capabilities are greatly increased.
Machine learning and deep learning models work easily with many types of complex patterns, trends, and relationships in GIS data. AI frameworks like Esri’s ArcGIS and open-source AI-powered tools such as QGIS can be integrated with AI frameworks like (TensorFlow and PyTorch) to enhance the potential of urban analysis.
Some key areas where AI and GIS intersect include:
- Image Classification: This would involve the use of CNNs to classify satellite imagery or aerial data.
- Spatial Pattern Recognition: AI may identify trends in either urban growth, road usage, or population distribution using the GIS layers.
- Prediction Analytics: AI-based GIS models can predict how land is used, traffic flow, and environmental changes.
Computer vision for urban analysis
Computer vision (CV) techniques can be very helpful in analyzing visual data, such as satellite imagery, drone footage, or street-level photographs. With deep learning-based CV models, such as CNNs, LIDAR, Stereo Vision, etc., urban planners can automate the identification of objects and patterns-such as buildings, roads, or traffic lights.
Here are some notable examples:
- Change Detection: CV algorithms can compare geospatial images from different periods to detect changes in infrastructure, land use, and environmental features. For example, to assess urban expansion, deforestation, or disaster damage (e.g. following an earthquake or flood).
- Infrastructure Inspection and Maintenance: Smart CV technology enables drones to detect holes, cracks, or wear on bridges, roads, and buildings. This means maintenance can be carried out on time without human intervention.
- Traffic Monitoring: GEOINT technologies based on a CV can be used to analyze live video feeds from cameras for vehicle movement, congestion, and pedestrian traffic information. This data helps with traffic light control optimization, improves road safety, predicts congestion patterns, and more.
- 3D Urban Modeling: Likewise, based on CV algorithms, the geospatial intelligence model can create high-definition 3D models of the urban environment by processing stereo or LIDAR imagery. These 3d models can be used for infrastructure planning, construction projects, and disaster preparedness.
- Pedestrian and Crowd Analysis: Computer vision helps to track pedestrian activities to optimize public spaces. It will make the public safe, including large events or big social or political gatherings. It can also prevent overcrowding and improve urban mobility.
- Parking Management: Vision-based GEOINT systems can identify vacant and occupied parking spots in real time from camera feeds.
Machine learning models for urban analysis
Machine learning algorithms can be used to analyze the vast amount of geographical data collected by satellites, drones, and IoT sensors. Some key ML algorithms we use for urban analysis include:
- Regression Models: These models can determine the relationships between variables such as traffic flow, infrastructure, and population density. This assists the authorities in controlling urban expansion and traffic properly.
- Decision Trees and Random Forests: Segmentation of urban landscapes using satellite imagery and geospatial data is an important part of land use planning and resource allocation and these machine learning algorithms can handle it.
- Convolutional Neural Networks: CNNs can be trained to identify buildings, roads, and other urban structures in high-resolution satellite images. Hence it can record urban growth, detect change, and identify infrastructure needs.
- Recurrent Neural Networks and LSTM: These ML algorithms analyze time-series data. AI geospatial intelligence can help predict future traffic or environmental conditions.
- Support Vector Machines: SVMs can retrieve and classify urban features in geospatial data, such as roads, green open spaces, and water bodies for the betterment of urban design and environmental planning.
Steps to build an AI Geospatial-Intelligence system
There are three major stages in building an effective AI GEOspatial INTelligence system: data collection, model training, and deployment. Each step requires the use of specific AI tools and technologies to transform raw geospatial data into actionable insights.
Here are the steps:
Data collection:
The first step towards building any AI model consists in accessing raw datasets, which need to be accurate.
Let me show you some of the open-source platforms for raw data collection:
- OpenStreetMap: Global map platform that contains decent geospatial data on the streets, buildings, and landscapes
- Satellite Imagery: Publicly available data from NASA’s Landsat or the European Space Agency’s Sentinel program.
- IoT Devices: Real-time data from traffic cameras, environmental sensors, and smart devices.
- Drones and Aerial Surveys
Model training
After the data is collected, the next thing to do is train machine learning models to help analyze geospatial information. That’s where the right algorithms and features need to be selected for accurately modeling urban dynamics.
A typical geospatial intelligence pre-training would normally look something like this for most AI models:
- Preprocessing: Filtering and structuring raw data for analysis.
- Feature Engineering: Features that are relevant to extract for analysis, e.g., the volume of traffic, road network, or urban boundaries.
- Model Selection: Choosing appropriate algorithms, such as regression models for predicting traffic flows or CNNs for image analysis on satellite imagery.
- Training: Using large datasets, we train the model to find patterns and come up with predictions.
Deployment
After being trained, these models are then installed into real-time systems to continually dissect new geospatial data in search of actionable insights. This kind of integration can be with geospatial platforms that as GIS platforms, mobile apps, or web-based dashboards used by urban planners and city officials.
Example Tutorial for Traffic Flow Prediction Model
In this tutorial, we will develop a predictive model for traffic flow management using historical and real-time geospatial data. We will use Python, alongside libraries for data processing like Pandas, Scikit learn for machine learning, and Matplotlib for visualization.
Step 1: data collection
The Annual Average Daily Traffic (AADT) dataset for ALL-vehicle data on California State Highways has been collected for this purpose.
Source data can be found here.
This dataset contains traffic volume data for various locations, with columns including:
- District numbers
- Route numbers
- County names
- Description of the location
- Traffic volume statistics for the “back” direction
- Traffic volume statistics for the “ahead” direction
Step 2: data preprocessing
We will pre-process this traffic dataset to extract features such as time of day, location, and number of vehicles.
Below is a Python code to pre-process the traffic data:
We run Python code in the environment Visual Studio.
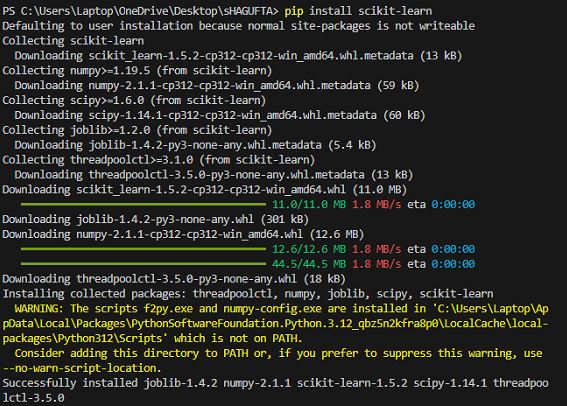
First, we got to install Scikit Learn:
In Terminal, execute the following code > “pip install scikit-learn” and hit ENTER
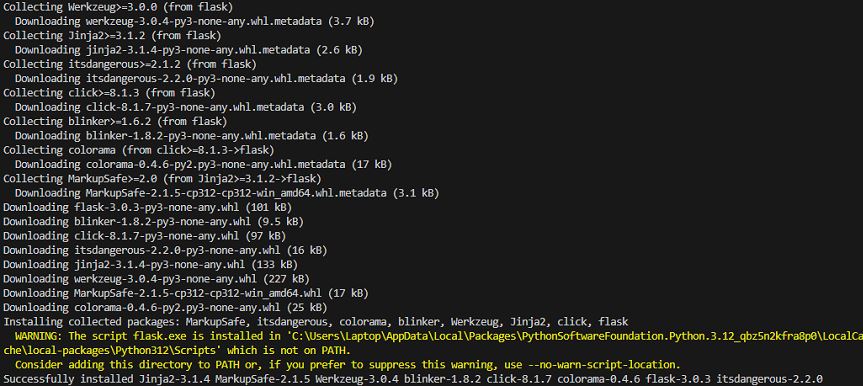
Then, install Flask
After that, in this terminal, type “pip install flask”, and press ENTER
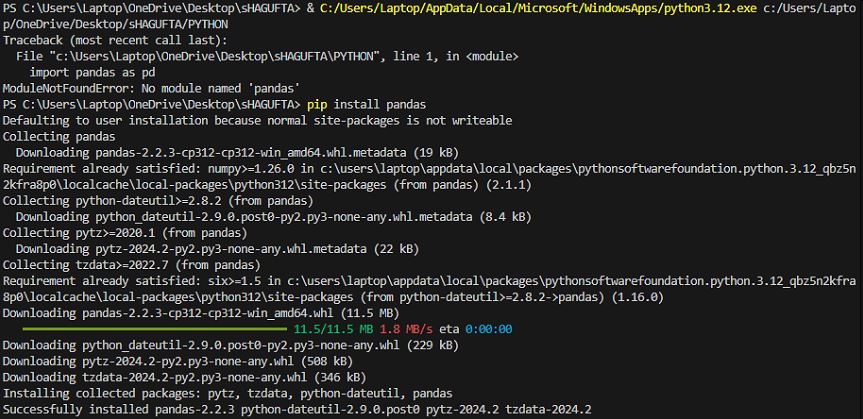
Then install Pandas
In Terminal, write “pip install pandas” and again press ENTER
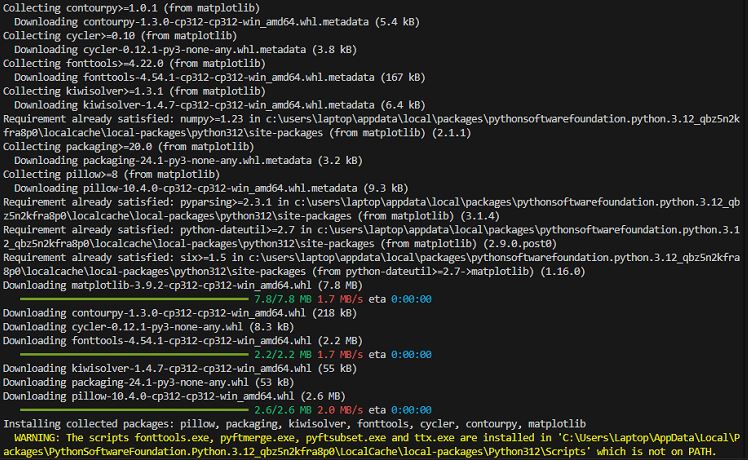
Next, move on to installing matplotlib
In Terminal, write “pip install matplotlib” and press ENTER
Once the libraries are installed, move on to the next steps for data processing:
import pandas as pd
import numpy as np
from sklearn.model_selection import train_test_split
from sklearn.preprocessing import StandardScaler
# Load the relevant sheet '2022 AADT DATA' from the Excel file
file_path_xlsx = '2022-traffic-volumes-ca.xlsx'
traffic_data_xlsx = pd.read_excel(file_path_xlsx, sheet_name='2022 AADT DATA')
# Display the first few rows to confirm successful loading
traffic_data_xlsx.head()
from sklearn.model_selection import train_test_split
from sklearn.preprocessing import StandardScaler
# Fill missing values with zero for simplicity
traffic_data_xlsx.fillna(0, inplace=True)
# Extract relevant columns: BACK_PEAK_HOUR and AHEAD_PEAK_HOUR for prediction
X = traffic_data_xlsx[['BACK_PEAK_HOUR']]
y = traffic_data_xlsx['AHEAD_PEAK_HOUR']
# Handle any missing or malformed values (already handled with fillna earlier)
X = X.fillna(0)
y = y.fillna(0)
# Split the data into training and testing sets (80% training, 20% testing)
X_train, X_test, y_train, y_test = train_test_split(X, y, test_size=0.2, random_state=42)
# Normalize the feature set
scaler = StandardScaler()
X_train_scaled = scaler.fit_transform(X_train)
X_test_scaled = scaler.transform(X_test)
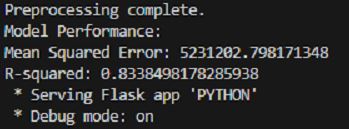
print("Preprocessing complete.")
Step 3: implementing a traffic flow prediction model
We’ll use a regression model to predict future traffic flows based on historical patterns. We will be using the LinearRegression model from Scikit-learn for this purpose:
from sklearn.linear_model import LinearRegression
from sklearn.metrics import mean_squared_error, r2_score

# Initialize the Linear Regression model
model = LinearRegression()

# Train the model using the training data
model.fit(X_train_scaled, y_train)

# Make predictions using the testing data
y_pred = model.predict(X_test_scaled)

# Evaluate the model
mse = mean_squared_error(y_test, y_pred)
r2 = r2_score(y_test, y_pred)

print(f"Model Performance: \nMean Squared Error: {mse}\nR-squared: {r2}")
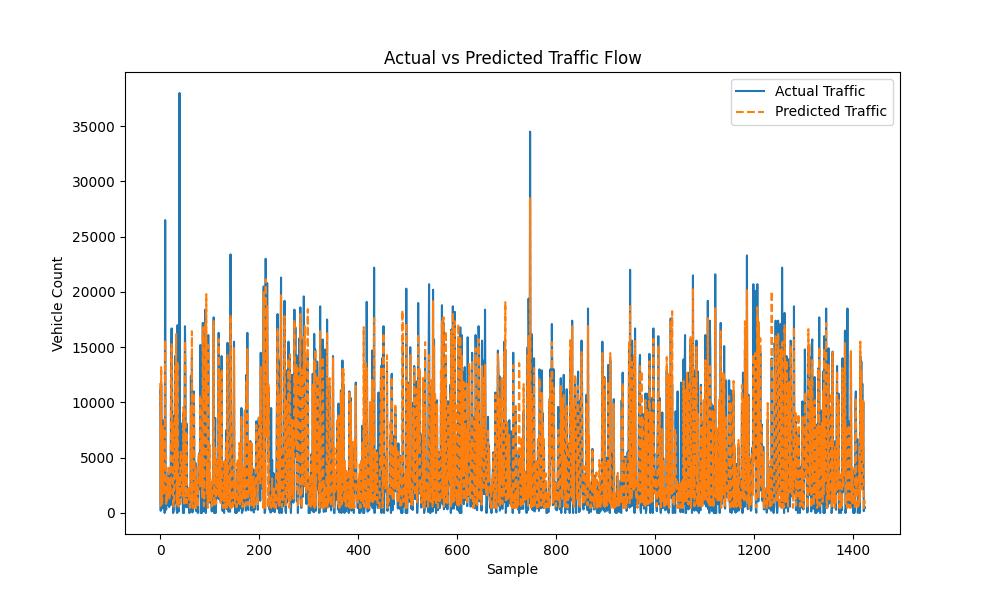
Step 4: visualizing predictions
Now we’ll visualize the predicted and actual traffic flows using Matplotlib:
import matplotlib.pyplot as plt

# Visualize actual vs predicted traffic values
plt.figure(figsize=(10, 6))
plt.plot(y_test.values, label='Actual Traffic')
plt.plot(y_pred, label='Predicted Traffic', linestyle='--')
plt.xlabel('Sample')
plt.ylabel('Vehicle Count')
plt.title('Actual vs Predicted Traffic Flow')
plt.legend()
plt.show()
The plot provides a visual comparison between the real and forecasted values of the traffic flow, showing how well the model performs in predicting traffic patterns over time. Refining the model by including more advanced features like weather conditions, event schedules, and road conditions would lead to much more accurate predictions.
Step 5: deployment
Once the model performs well, you can then consider it for real-time deployment. By this, you mean integrating the model with a web-based dashboard or a mobile application where city planners can have access to traffic predictions. This is supported by Flask or FastAPI. These make a lightweight API serving the traffic predictions to a front-end interface.
Here is a very basic example of how you might set an API to serve the traffic predictions using Flask:
from flask import Flask, request, jsonify
import joblib

# Save the model
joblib.dump(model, 'traffic_model.pkl')

# Initialize Flask app
app = Flask(__name__)

# Load the saved model
model = joblib.load('traffic_model.pkl')

@app.route('/predict', methods=['POST'])
def predict():
    data = request.get_json()
    back_peak_hour = data['back_peak_hour']

    # Scale input
    input_data = scaler.transform([[back_peak_hour]])

    # Make prediction
    prediction = model.predict(input_data)

    return jsonify({'predicted_traffic': prediction[0]})

if __name__ == '__main__':
    app.run(debug=True)
Here, the API will accept a POST request with data regarding time of day and day of the week about flow in traffic. It responds with a forecast of the same. This API may later be integrated and used with a frontend dashboard, where a user may see all the predictions live.
How to Run the Flask API:
Install Flask:
In terminal type, “pip install flask.”
Run the Flask app:
python app.py
You can send a traffic data POST request-for example, time of day, latitude, and longitude- and the API responds with a reply containing the predicted flow of traffic.
Example POST request body:
{
“hour”: 15,
“location_lat”: 37.7749,
“location_long”: -122.4194
}
This API is going to return the vehicle count by prediction for the given time and location.
Challenges and limitations
Data quality and availability
Most AI geospatial systems are limited by inconsistent, outdated, or incomplete data, especially in remote areas.
Computational demand
Large-scale geospatial analysis prohibits the scalability of AI solutions due to the need for a huge number of computations.
Model transparency
Most AI models, specifically deep learning, are not transparent, and it is quite hard for a decision maker to understand how they reach a conclusion.
Resolution trade-offs
High spatial and temporal resolution thus increases precision but has costs; low resolution may lead to erroneous analyses.
Real-time integration
Integrating real-time data into AI models is a big challenge due to the lack of consistency in the intervals at which they are updated (data latency) and inconsistent updates across different platforms.
Environmental variability
Different topography, infrastructure, traffic flow, and human behavioral patterns make most AI models not able to generalize over regions.
Lack of standardization
The work of integrating and making consistent models is made more difficult because there is a serious lack of standardization in geospatial data formats and protocols.
Cost
The exorbitant cost of setting up and maintaining such geospatial AI systems has limited accessibility to smaller-scale organizations or governments.
What’s next with vision-powered geospatial intelligence
AI-driven smart cities
With the rise of smart technologies in cities, smart AI Geospatial Intelligence will become a crucial piece of managing these urban ecosystems. Some of these items will become automated: Real time analysis of traffic flows, control and use of public transport, and optimization of energy use.
3D Geospatial Intelligence
The future of geospatial intelligence will be much more than 2D maps and imagery. AI-powered 3D modeling of cities will have the planners visualizing the infrastructure in three dimensions. Help them to plan skyscrapers, underground transportation, and utilities.
Integration with Edge Computing
Because of the challenges increasing in real-time data processing. AI geospatial intelligence may lean increasingly on edge computing, where data is processed locally on devices (such as cameras or even traffic lights) earlier to be sent to centralized systems for further analysis.
AI and drones
Drones will be everywhere, carrying AI-powered geospatial intelligence systems to monitor urban environments. The systems can inspect infrastructure, monitor the traffic flow, or assess damage after natural disasters.