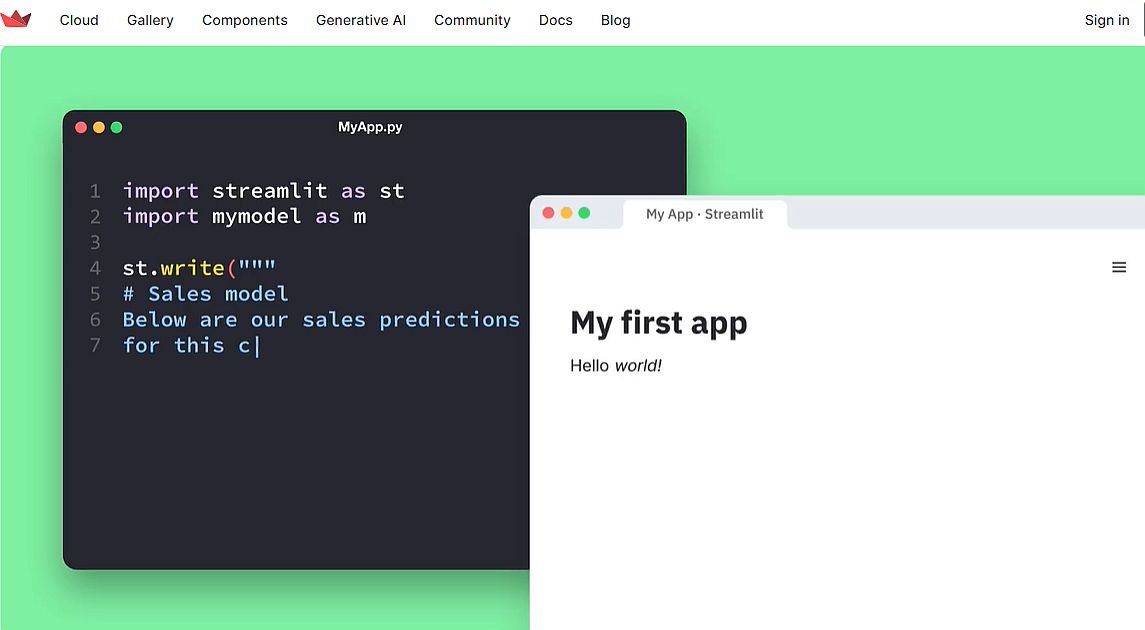
One of the important aspects of successful application development is to create an effective and intuitive user interface. Modern data-oriented apps face the problem of building an effective user interface quickly, without undertaking complex steps. In this article – we present a short tutorial on how to utilize Streamlit to create a successful web application.
Streamlit is a good choice for developers and teams that are well-versed in data science and want to deploy AI models easily and quickly, with a few lines of code.
What is Streamlit?
Streamlit is a Python-based library specifically developed for machine learning engineers. It is an open-source, free framework that allows the quick creation and sharing of good-looking machine-learning web applications.
Computer vision and machine learning specialists are not web developers. They can’t spend months learning to use frameworks for building web apps. Instead, they want a tool that is easy to learn and use, i.e. can efficiently display data and collect needed parameters for modeling. Streamlit allows them to create a great-looking application with only a few lines of code.
Why is Streamlit useful in Machine Learning?
Machine learning extracts hidden information and insights from big data using statistical methods and techniques. After performing the data mining process, the next step is data visualization. It will assist users and executives in identifying important information extracted from the data.
Sometimes, machine learning results generate a lot of data without providing clear insights. To facilitate data visualization, it is necessary to have a visualization tool. It can create an interactive display to make it easier for users to use.
Streamlit is easy to learn, especially for people with no front-end knowledge, to put their code into a web application:
- It requires less code to create good-looking web apps.
- It speeds up the computation pipeline by using data caching.
- You don’t need experience with front-end technologies (HTML, CSS, JavaScript).
- You won’t need months to create a web app; you’ll create a machine-learning app in a few hours.
- Streamlit is compatible with most Python libraries (e.g., matplotlib, seaborn, pandas, Plotly, Keras, PyTorch, SymPy).
How to Run Streamlit: Hands-on Features
Displaying Text
Streamlit possesses these functions for text display:
- st.write – accepts multiple arguments and data types and displays them on the screen. Example:
st.write ("Hello, how are you doing? ")
- st.title – sets and displays the title of an application. Example:
st.title ("This is the application title")
- st.text(“Text1”) – displays fixed-width and preformatted text.
- st.header(“Header1”) – sets the header in the text.
Displaying Images, Audio, Video Files
With Streamlit, you can display images, audio, and video files with its functions. For instance, the function to display an image is:
st.image(image, caption=None, width=None, use_column_width=None, clamp=False, channels="RGB", output_format="auto")
For example: import streamlit as st
st.image(mountain.jpg', caption='Mountain landscape')

- st.audio(data, format=”audio/wav”, start_time=0, *, sample_rate=None) – function that displays audio files.
- st.video(data, format=”video/mp4″, start_time=0, *, subtitles=None) – function that displays video files.
Input Widgets in Streamlit
Streamlit offers different widgets that you can plug directly into your apps, such as buttons, sliders, text inputs, etc.
- st.button() – function that displays a button widget.
- st.radio() – function that displays a radio button widget.
- st.checkbox() – function that returns a Boolean value. When checked, the box returns a True value; otherwise, a False value.
- st.selectbox() – function that displays a select widget, to enable the user to select an item.
- st.multiselect() – function that displays a multiselect widget.
- st.slider() – function that displays a slider widget, e.g., a range slider that supports int, float, date, time, and datetime types.
- st.number_input() – function that displays a numeric input widget.
- st.text_input() – function that displays a text input widget.
Displaying App Progress and Status
Streamlit can also display the progress and the success status of your app.
- st.progress() – function that displays a progress bar.
- st.spinner() – function that displays a temporary waiting message during execution.
- st.success() – function that displays a success message.
- st.error() – function that displays an error message, e.g., a pop-up window.
- st.warning () – function that displays a warning message.
- st.info() – function that displays an informational message, e.g., via a pop-up window.
- st.exception() – function that displays an exception message.
Sidebar and Container in Streamlit
The order and arrangement of pages on your app can have a large impact on your user experience. By well-arranging your content, visitors will understand and navigate your site better. Consequently, they’ll be able to find what they’re looking for, and that will enhance the user experience. To organize your app with Streamlit, you can create a sidebar or a container on your page.
- st.sidebar() – creates a sidebar in your app interface and puts elements inside. Therefore, you’ll make your app more organized and easier to understand.
- st.container() – creates an invisible container where you can put elements to create a useful arrangement and hierarchy.
import streamlit as st

with st.container():

st.write("This is inside the container")

# You can call any Streamlit command, including custom components:

st.bar_chart(np.random.randn(50, 3))

st.write("This is outside the container")
Displaying Graphs and Visuals
Data visualization helps users to understand data quickly and accurately, unveiling the trends and outliers. The data and the visuals should work together to provide good analysis and proper decision-making.
The visualization tools give us a clear idea of what the information means by providing visual context through maps or graphs. Streamlit offers the power of visualization with its functions:
st.pyplot() – function that displays a matplotlib.pyplot figure.
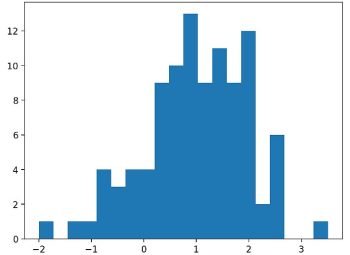
For example, the following code displays the graph above.
import streamlit as st

import matplotlib.pyplot as plt

import numpy as np

arr = np.random.normal(1, 1, size=100)

fig, ax = plt.subplots()

ax.hist(arr, bins=20)

st.pyplot(fig)
Create a Machine Learning App
First Steps – Preparing Folders and Session State
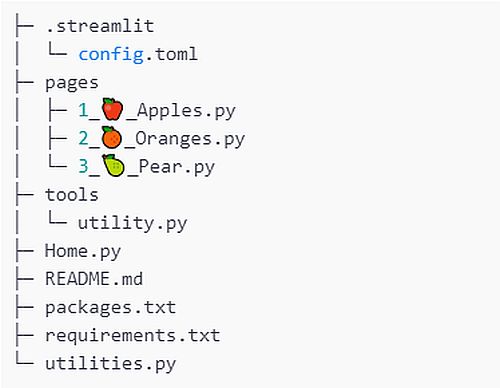
Medium-sized Streamlit projects are similar to most Python projects. Therefore, you can organize the files and folders as a pure Python project.
- Create an additional src/<project>/ui folder to put most of the functions/.py files. These functions (source files) call Streamlit to display input/results for other methods of the package.
- For an application with multiple pages, you can create a separate .py file per UI page.
- You can create a ui.py at the project level, which acts as the main entry point for the Streamlit app. After that, you use functions in the ui module to access the package.
You can utilize Session State to store variables across reruns, create events on input widgets, and use callback functions to handle events. This powerful capability allows app creation that can:
- Support Pagination
- Perform data/image annotation
- Add widgets that depend on other widgets
- Build simple stateful games like Battleship, Tic Tac Toe, etc.
You can find more information about the Streamlit session state here.
Configuring Streamlit Apps
Streamlit offers 4 different ways to configure your app. To view all available configuration options, you can run the following command:
streamlit config show
Here we present the configuration list in order. When you make the same configuration options multiple times, then you set command line flags before the environment variables.
- In the global config file at ~/.streamlit/config.toml for macOS/Linux or %userprofile%/.streamlit/config.toml for Windows:
[server]

port = 80
- In a per-project config file at $CWD/.streamlit/config.toml, where $CWD is the folder you’re running Streamlit from.
- By using STREAMLIT_* environment variables, such as:
export STREAMLIT_SERVER_PORT=80

export STREAMLIT_SERVER_COOKIE_SECRET=dontforgottochangeme
- As flags on the command line when running Streamlit run:
streamlit run your_script.py --server.port 80
If you make changes to .streamlit/config.toml while the app is running, you should restart the server, so the changes will be reflected in the app.
Developing a Machine Learning App
Using Streamlit, you can develop different types of ML apps, such as for data analytics, trends, forecasts, etc. On the homepage, you can display a summary of the data that you choose. In addition, the Exploration page would allow you to visualize variables in plots.
The Prediction page can contain variables with a Predict button that will estimate the main variable trend. There can be a sidebar that will allow you to select a page. You should cache the data regularly so that it does not reload constantly.
- You can store your variables in a dictionary by utilizing the get_value(val, dict1) and get_fvalue(val) functions for dictionaries.
- After that, the input – you can store the client’s input in a list named feature_list and then in a NumPy variable named single_sample.
- Then, you should load your saved RandomForestClassifier model in loaded_model and its prediction, which is 0 or 1 (classification problem).
- The .gif files should be stored in a file and file_. Therefore, based on the value of the prediction, you will have two cases, “Rise” or “Fall” for your trend prediction.
Developing an Image Classification App
For this purpose, you need to upload and process files in Streamlit. You can upload different types of image data (.jpg, .png), as well as other files such as CSV files, etc.
To implement image classification, you can utilize a pre-trained TensorFlow Hub AI model to build an application that can identify a person in an office. For this application, you’ll need the following packages:
- `streamlit` – as a basis
- `pillow` – to resize the image that the user will upload
- `matplotlib` – to display the image
- `tensorflow_hub` – to load the pre-trained model
- `numpy` – to expand the dimensions of the image
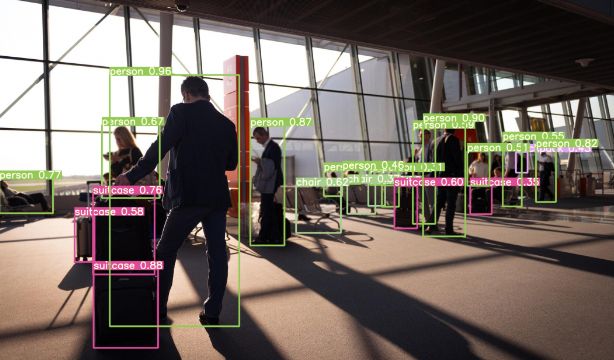
This application will have two main functions:
- Main function – allowing the user to upload an image
- Prediction function – running inference on the uploaded image
In the main function, you can use `header` to set the application heading as seen earlier. Then, you should use `st.file_uploader` to let the user upload an image. Also, you can specify accepted file types in the file uploader. After uploading the image, `Image` from Pillow is used to open it. Next, you run the prediction function, display the result, and plot the image below the result.
Within the prediction function, there are a few things that you need to do:
- Load the pre-trained model from TensorFlow Hub
- Resize the image uploaded by the user to the required size (the model requires a 300 x 300 image)
- Convert the image to an array and standardize it
- Include the batch size in the image dimension (for a single image, the batch size is 1)
- Run predictions and map them to class names
Deploying the App
You deploy your application by copying, configuring, and enabling it to a specific main URL. As a result, when you complete the deployment process, the application will become publicly accessible on the base URL
To deploy the Stremlit app, you should undertake the following steps:
- Create a new repository in GitHub and upload your project files there.
- Create a new file named ‘requirements’ where you have to put the libraries you used in your app.
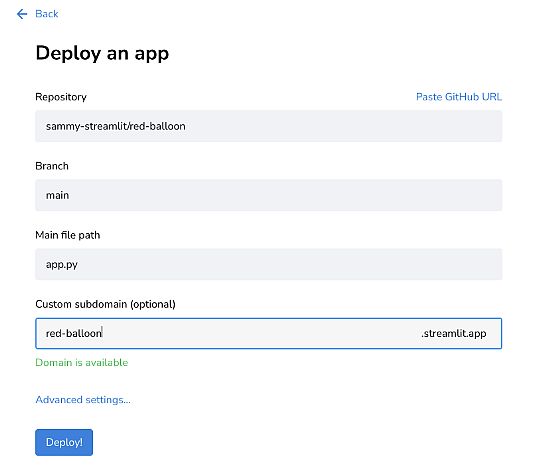
- Enter your repo, branch, and file path. As a shortcut, you can also click “Paste GitHub URL” to paste a link directly to your_app.py on GitHub. An app URL with a random hash is prefilled; however, you can also change this to a custom subdomain.
- Press the Deploy
- You can utilize Advanced Deployment settings (optional) – in case you are connecting to a data source or want to specify the Python version for your app.
What’s Next?
To learn more about computer vision and access more guides and tutorials, check out our other articles:
