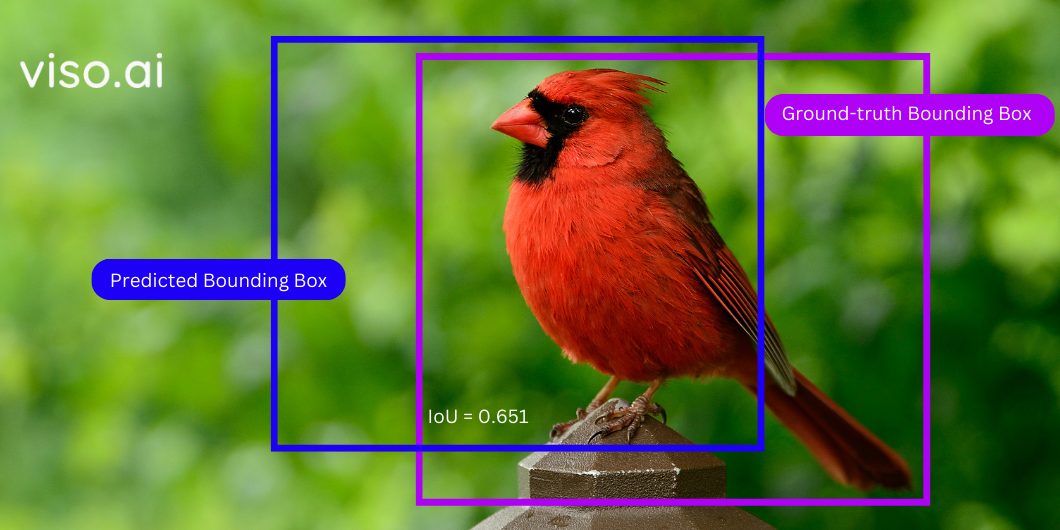
Intersection over Union (IoU) is a key metric used in computer vision to assess the performance and accuracy of object detection algorithms. It quantifies the degree of overlap between two bounding boxes: one representing the “ground truth” (actual location of an object) and the other representing the model’s “prediction” for the same object. It measures how well a predicted object aligns with the actual object annotation. A higher IoU score implies a more accurate prediction.
What is Intersection over Union (IoU)?
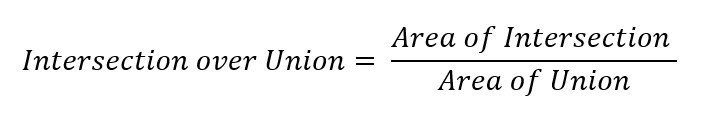
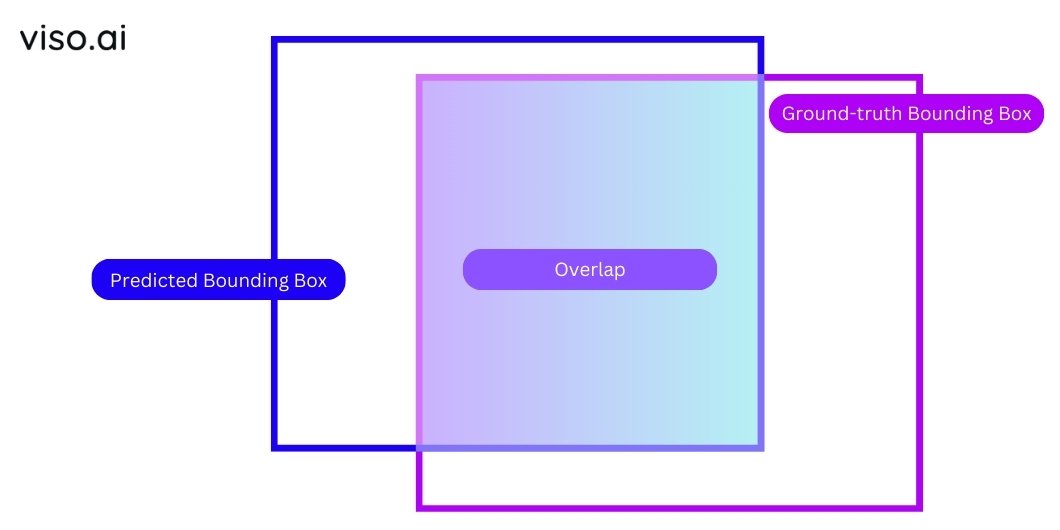
Intersection over Union (IoU), also known as the Jaccard index, is the ratio of the ‘area of intersection’ to the ‘area of the union’ between the predicted and ground truth bounding boxes. Thus, the IoU meaning consists of the quantitative measurement of how well a predicted bounding box aligns with the ground truth bounding box.
The IoU Formula
The mathematical representation is:
Where,
- Area of Intersection = Common area shared by the two bounding boxes (Overlap)
- Area of Union = Total area covered by the two bounding boxes
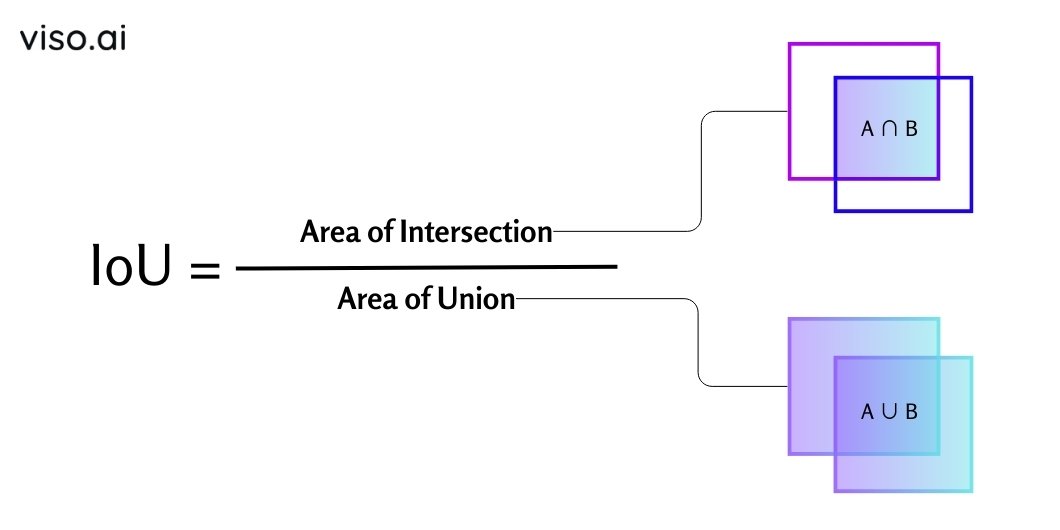
This formula produces a value between 0 and 1, where 0 indicates no overlap, and 1 indicates a perfect match between the predicted box and ground truth bounding boxes.
Key Mathematical Components
To understand IoU, let’s break down its key components:
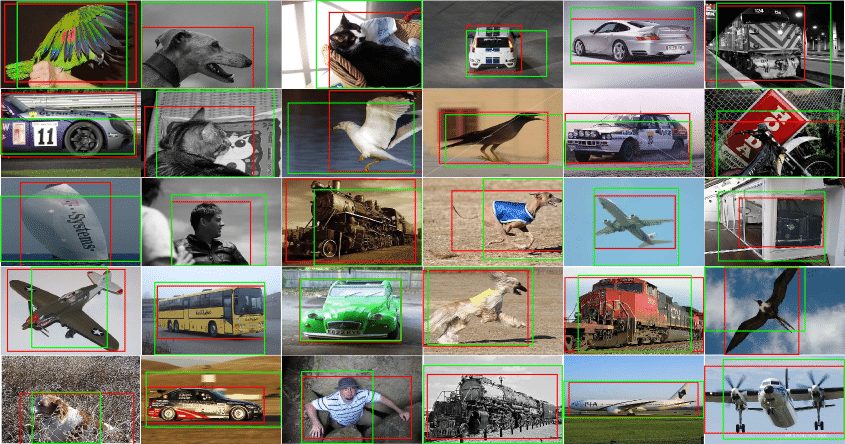
Ground Truth Bounding Box
A ground truth bounding box is a rectangular region that encloses an object of interest in an image. It defines the exact location and size of an object in an image and serves as the reference point for evaluating the model’s predictions.
Predicted Bounding Box
A predicted bounding box is a rectangular region that a computer vision model generates to detect and localize an object in an image. It represents the algorithm’s estimate of the object’s location and extent within the image. The degree of overlap between the predicted bounding box and the ground truth box determines the accuracy of the prediction.
Overlap
Overlap is a term that describes how much two bounding boxes share the same space. A larger overlap indicates better localization and accuracy of the predicted model.
Precision and Recall Definitions
Precision vs. recall are two metrics to evaluate how well a computer vision model performs on a detection task. Precision measures the accuracy of the predicted bounding boxes, while recall measures the model’s ability to detect all instances of the object.
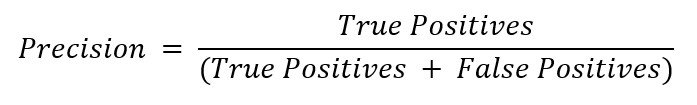
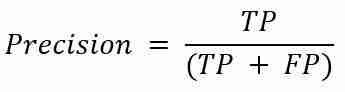
Precision defines how many true positives (correct detections) the model made. It is the ratio of True Positives (TP) to the sum of True Positives and False Positives (FP).
OR
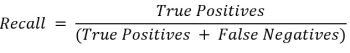
Recall indicates how many true positives the model has missed. It is the ratio of True Positives to the sum of True Positives and False Negatives (FN).
OR
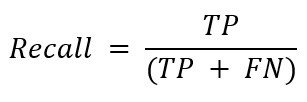
Where,
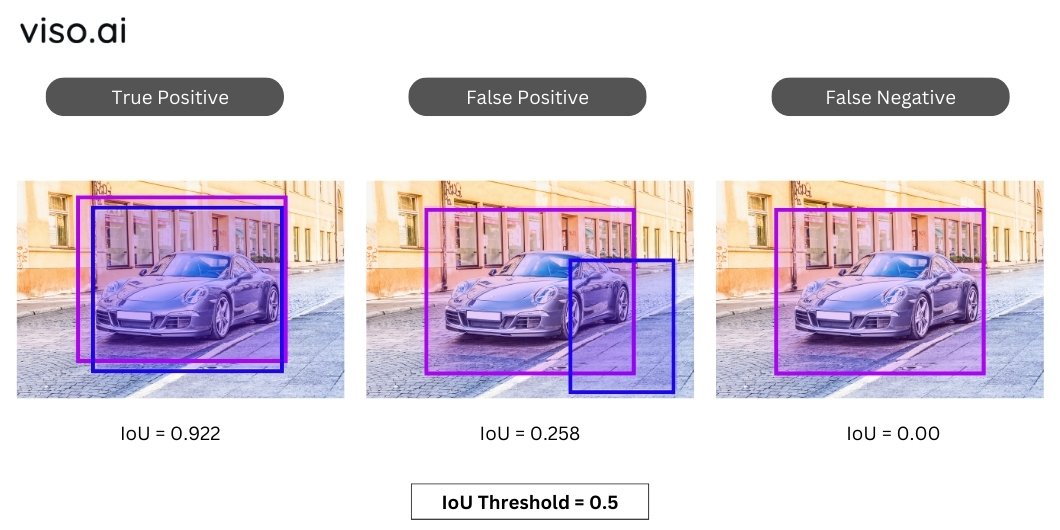
- True Positive (TP) is a predicted bounding box with a high enough IoU (usually 0.5+ thresholds).
- False Positive (FP) is a predicted bounding box that doesn’t overlap significantly with any ground truth box, indicating the model incorrectly detected an object.
- False Negative (FN) is a ground truth box that the model missed entirely, meaning it failed to detect an existing object.
How is IoU Calculated?
Consider the following example:
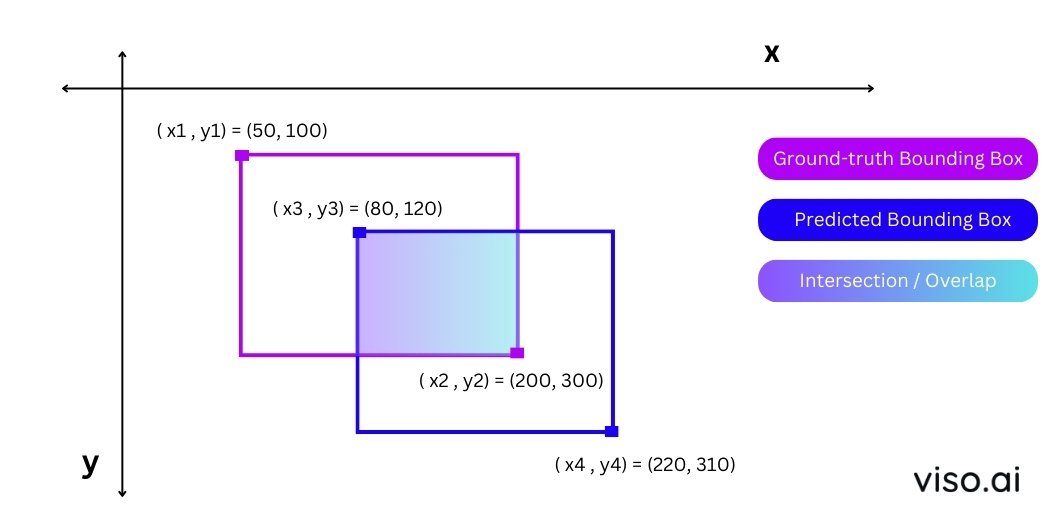
Coordinates of Ground Truth Bounding Box:
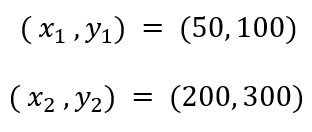
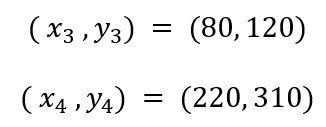
Predicted Bounding Box Coordinates:
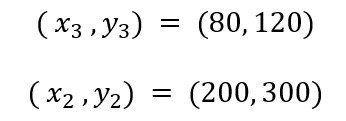
Coordinates of Intersection Region:
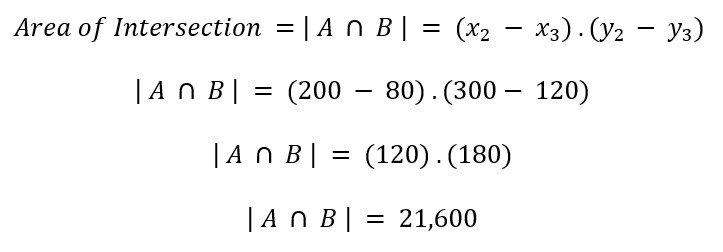
Step 1: Calculating the Area of Intersection
The area of intersection is the common area shared by the ground truth bounding box and the predicted bounding box. You can calculate the area of the intersection/overlapping region by finding the coordinates of its top-left and bottom-right corners.
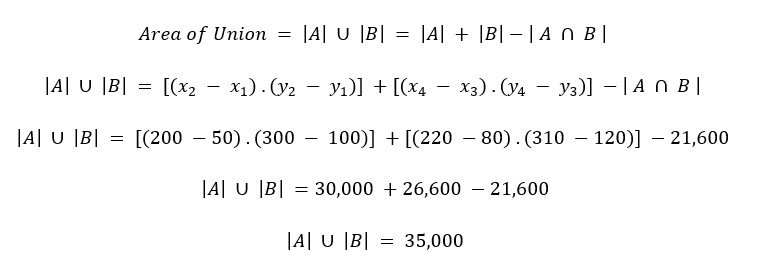
Step 2: Calculate the Area of Union
The area of union is the total area covered by the ground truth bounding box and the predicted bounding box. To find the area of union, add the areas of both bounding boxes and then subtract the area of intersection.
Step 3: Interpret IoU
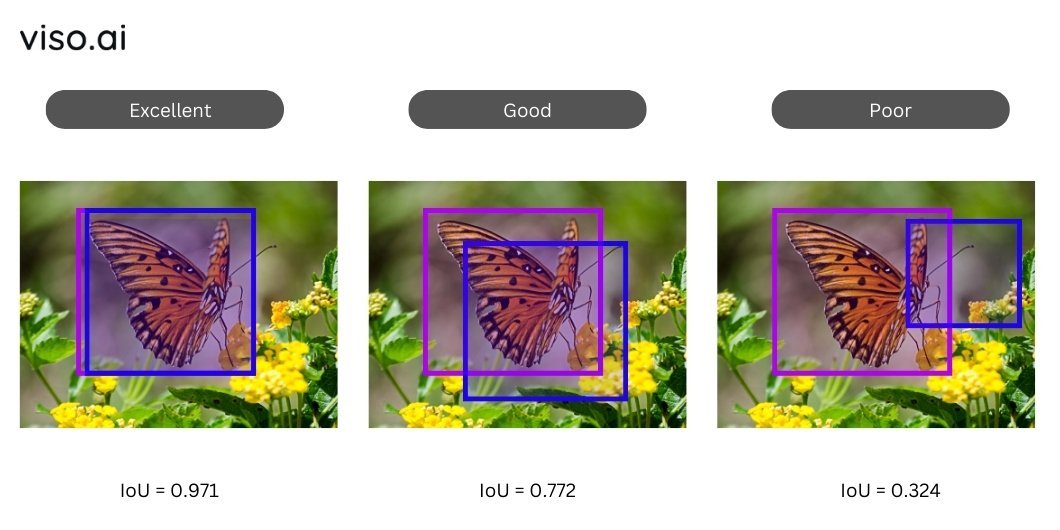
We compute the IoU by dividing the area of the intersection by the area of the union. A higher IoU value indicates a more accurate prediction, while a lower value suggests a poor alignment between the predicted and ground truth bounding boxes.
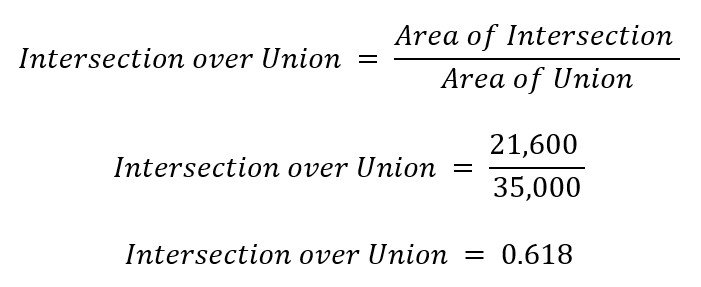
The model’s Intersection over Union (IoU) for the example under consideration is 0.618, suggesting a bare overlap between the predicted and actual outputs.
Acceptable IoU values are typically above 0.5, while good IoU values are above 0.7.
However, these thresholds may vary depending on the application and task.
Step 4: Adjust Thresholds for Precision and Recall
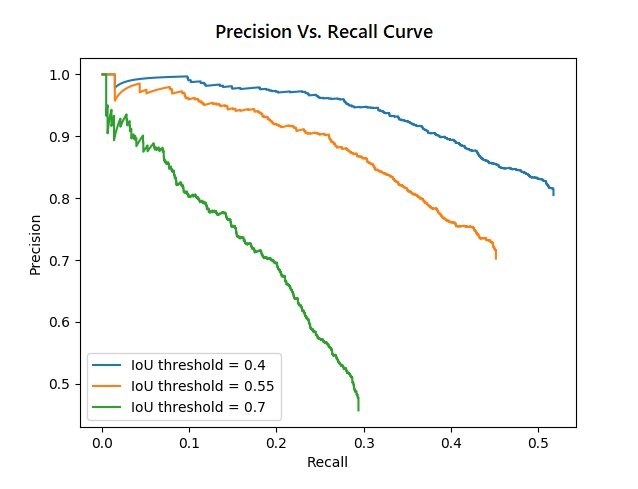
The intersection-over-union (IoU) threshold acts as a gatekeeper, classifying predicted bounding boxes as true positives if they pass the threshold and false positives if they fall below it. By adjusting the threshold, we can control the trade-off between precision and recall. A higher threshold increases precision (fewer false positives) but decreases recall (more missed positives). Conversely, a lower threshold increases recall but decreases precision.
For example, to prioritize precision over recall, set a higher IoU threshold for a positive detection, such as 0.8 or 0.9. The algorithm counts only predictions with a high degree of overlap with the ground truth as true positives, while it counts predictions with a low degree of overlap as false positives. This will result in a higher precision but a lower recall.
Conversely, to prioritize recall over precision, set a lower IoU threshold for a positive detection, such as 0.3 or 0.4. This means that predictions that partially overlap with the ground truth are true positives, while those with no overlap are false negatives. This will result in a lower precision but a higher recall.
Role of IoU in Benchmarking Computer Vision Models
IoU forms the backbone of numerous computer vision benchmarks, allowing researchers and developers to objectively compare the performance of different models on standardized datasets. This facilitates:
Objective Comparison: Allows researchers and developers to compare models across different datasets and tasks quantitatively.
Standardization: Provides a common IoU Intersection over Union metric for understanding and tracking progress in the field.
Performance Analysis: Offers insights into the strengths and weaknesses of different models, guiding further development.
Popular benchmarks like Pascal VOC, COCO dataset, and Cityscapes use IoU as their primary metric for comparing model performance and accuracy. Let’s discuss them briefly:
Pascal VOC
Pascal VOC (Visual Object Classes) is a widely used benchmark dataset for IoU object detection and image classification. It consists of a large collection of images labeled with object annotations. IoU is used in Pascal VOC to evaluate the accuracy of object detection models and rank them based on their performance.
The main IoU metric used for evaluating models on Pascal VOC is mean average precision (mAP), which is the average of the precision values at different recall levels. To calculate mAP, the IoU threshold is set to 0.5, meaning that only predictions with at least 50% overlap with the ground truth are considered positive detections.
MS COCO
Microsoft’s Common Objects in Context (COCO) dataset is renowned for its complexity and diverse set of object classes. IoU plays a central role in assessing the accuracy of object detection and image segmentation algorithms competing in the COCO benchmark.
Cityscapes Dataset
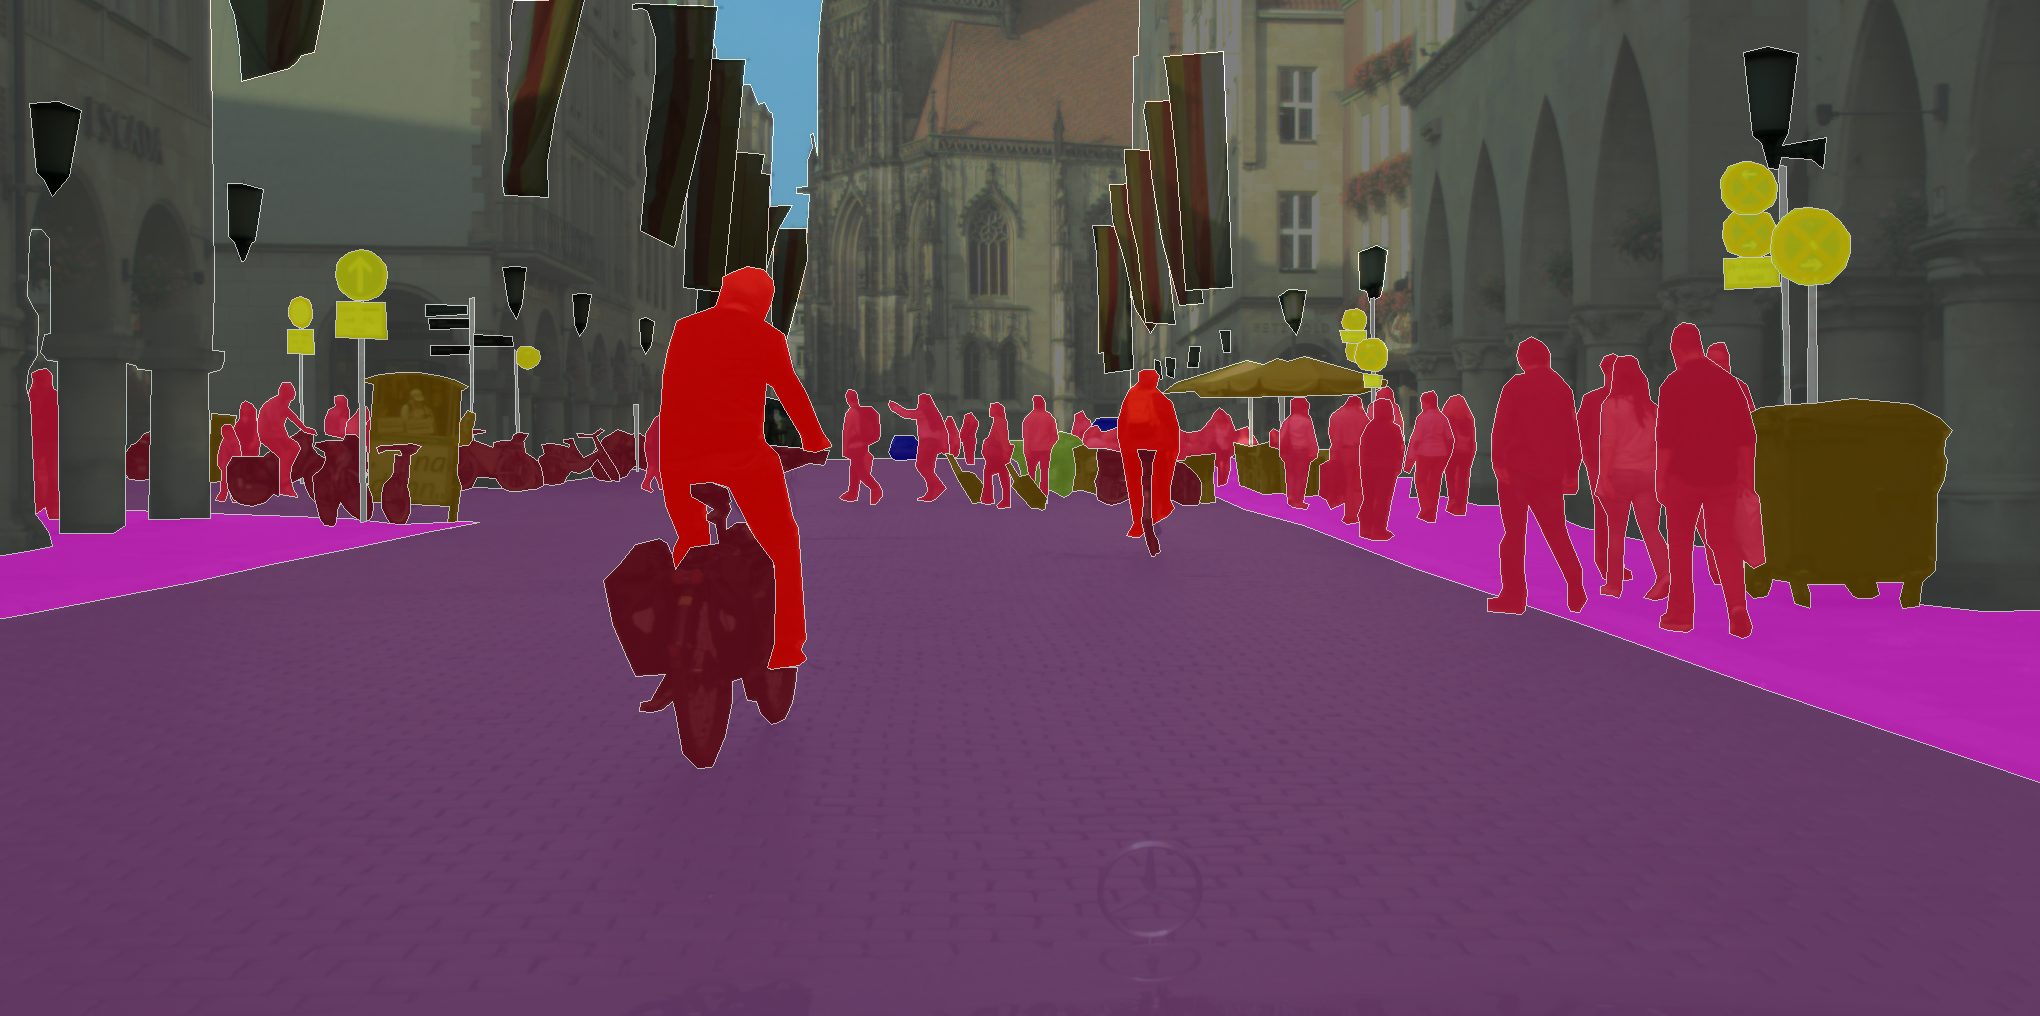
Cityscapes focuses on a semantic understanding of urban scenes. This benchmark focuses on pixel-level semantic segmentation, where IoU measures the accuracy of pixel-wise predictions for different object categories. It aims to identify and segment objects within complex city environments, contributing to advancements in autonomous driving and urban planning.
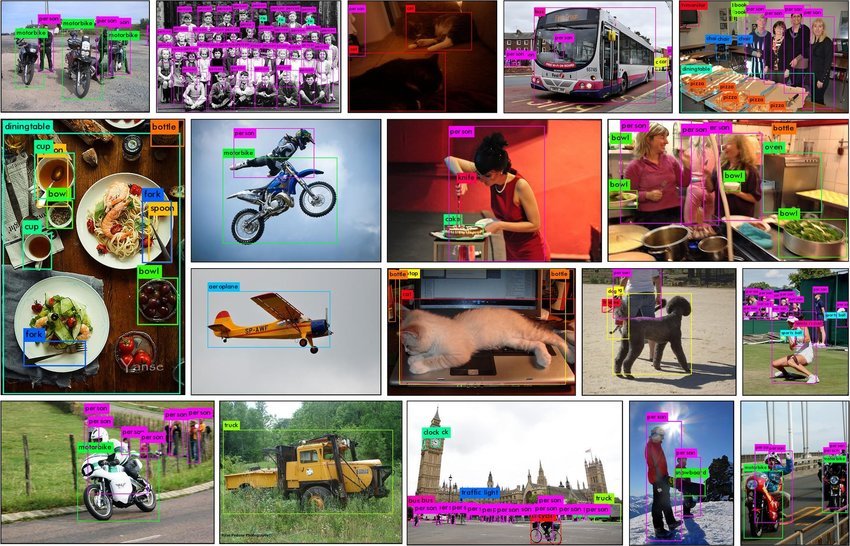
Real-World Applications of IoU
IoU has a wide range of applications in computer vision beyond benchmarking. Here are some real-world scenarios where IoU plays a crucial role:
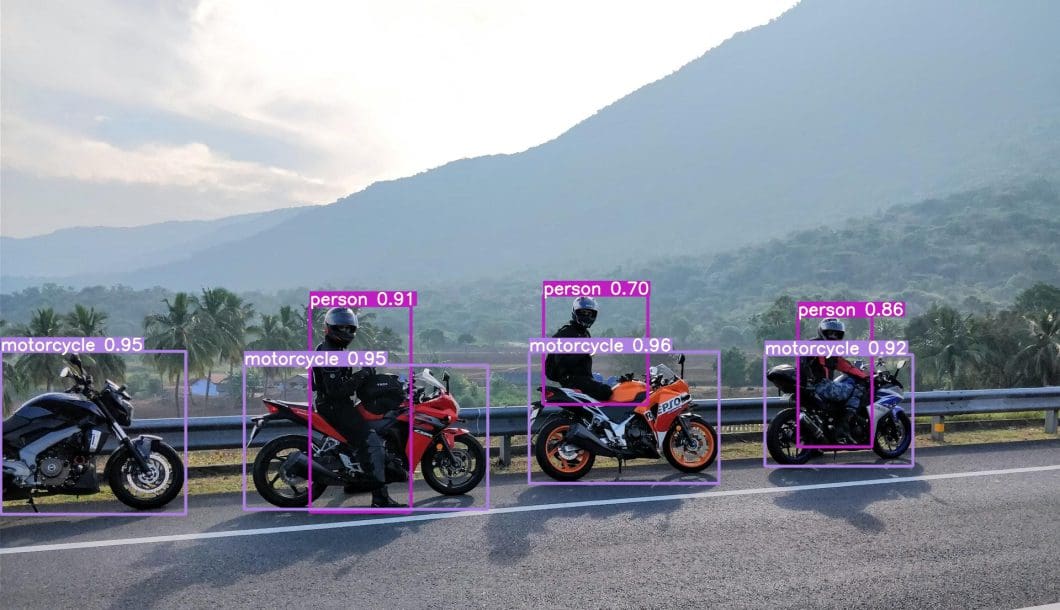
Object Detection and Localization
IoU is extensively employed in object detection tasks to measure the accuracy of bounding box predictions. It helps in identifying the regions where the model excels and where improvements are needed, contributing to the refinement of detection algorithms.
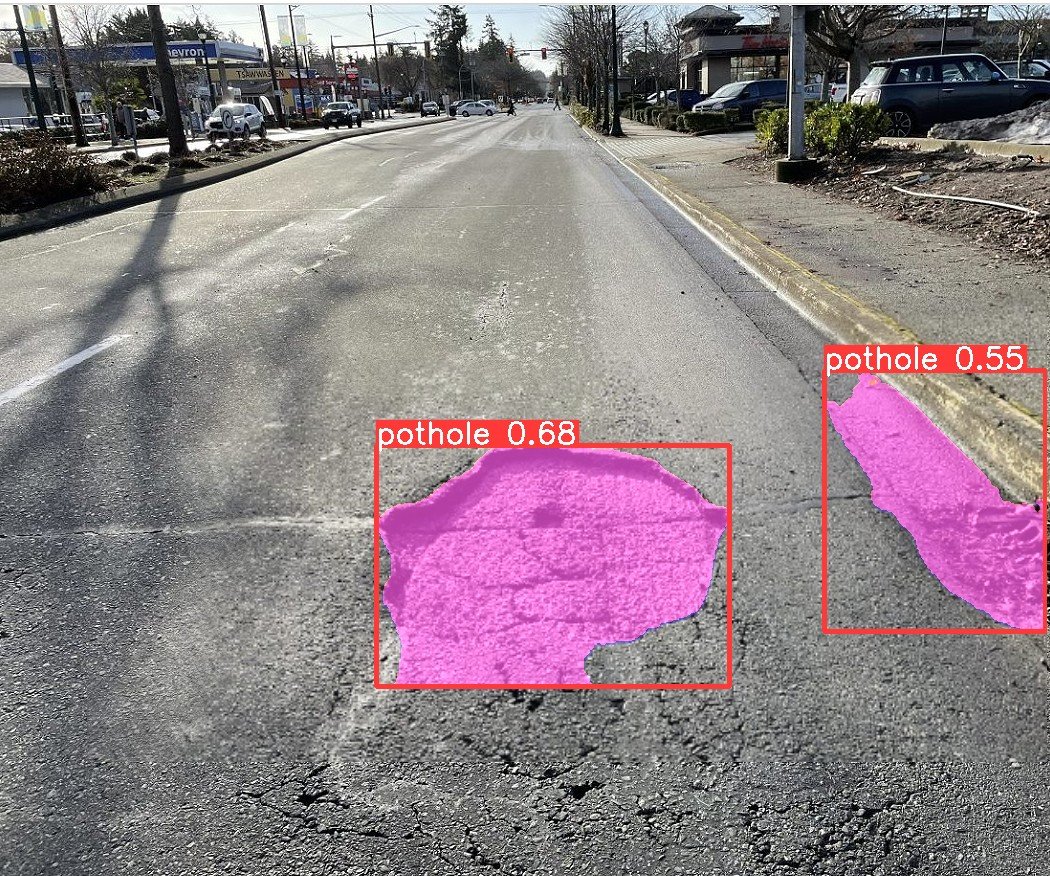
Segmentation
In image segmentation, IoU is applied to evaluate the accuracy of pixel-wise predictions. It aids in quantifying the degree of overlap between predicted and ground truth segmentation masks, guiding the development of more precise Intersection over Union segmentation algorithms.
Information Retrieval
IoU is valuable in information retrieval scenarios where the goal is to locate and extract relevant information from images. By assessing the alignment between predicted and actual information regions, IoU facilitates the optimization of retrieval algorithms.
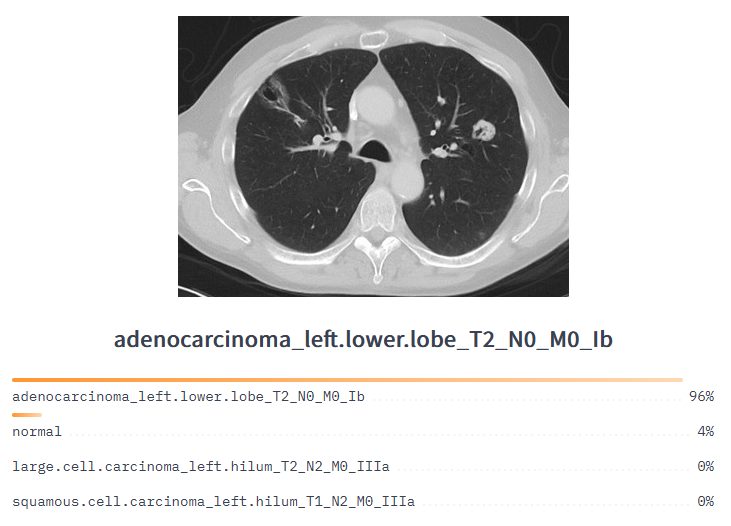
Medical Imaging
In medical imaging, accurate localization of structures such as tumors is critical. IoU serves as a metric to evaluate the precision of segmentation algorithms, ensuring reliable and precise identification of anatomical regions in medical images.
Robotics
IoU finds applications in robotics for tasks such as object manipulation and scene understanding. By assessing the accuracy of object localization, IoU contributes to the development of more robust and reliable robotic systems.
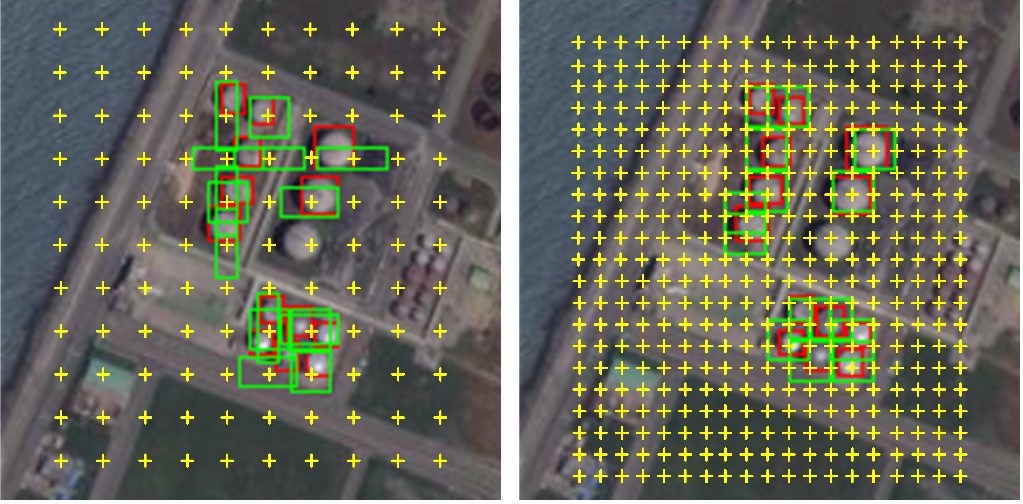
Remote Sensing
In remote sensing applications, IoU is used to evaluate the accuracy of algorithms in detecting and classifying objects within satellite or aerial imagery. It aids in the identification and classification of objects within large-scale geographical areas. It can measure how well the algorithm’s predictions align with the ground truth objects, providing a measure of classification accuracy.
IoU Challenges and Limitations
While powerful, IoU has its limitations:
- Sensitive to box size: IoU can be sensitive to the size of bounding boxes. A small shift in a large box may have a minimal impact on IoU, while the same shift in a small box might significantly change the score.
- Ignores shape and internal structure: It only considers the overlap area, neglecting objects’ shape and internal structure. The consequences could be problematic is tasks with important feature details, for example, in medical image segmentation.
- Inability to handle overlapping objects: It struggles to distinguish between multiple overlapping objects within a single bounding box. This can lead to misinterpretations and inaccurate evaluations.
- Binary thresholding: It typically uses a binary threshold (e.g., 0.5) to determine whether a prediction is correct. As a result, the outcome can be overly simplistic and miss out on subtle differences in quality.
- Ignores confidence scores: It doesn’t consider the model’s confidence score for its predictions. This can lead to situations where a low-confidence prediction with a high IoU is considered better than a high-confidence prediction with a slightly lower IoU.
Future Advancements
As computer vision continues to advance, there is ongoing research and development to enhance the accuracy and reliability of IoU and related metrics. Some future advancements in IoU include the incorporation of object shape information, consideration of contextual information, and the development of more robust evaluation methodologies.
Advanced computer vision techniques, including the integration of neural networks, CNNs, and attention mechanisms, show promise in improving the accuracy and reliability of Intersection over Union object detection and localization metrics.
What’s Next?
IoU remains a fundamental metric in computer vision, and its role is expected to continue growing as the field advances. Researchers and developers will likely witness the refinement of IoU-based metrics and the emergence of more sophisticated approaches to address the limitations of current methodologies.
Here are some additional resources you might find helpful in gaining a deeper understanding of IoU and its related concepts in computer vision:
- A Comprehensive Guide to Computer Vision Annotation Tool (CVAT)
- AI Pattern Recognition and Its Role in Data Analysis
- Learn the Basics to Advance Concepts of Image Recognition
- Find the Most Popular Applications of Image Segmentation
- A Definitive Guide to Object Detection