Bias detection in Computer Vision (CV) aims to find and eliminate unfair biases that can lead to inaccurate or discriminatory outputs from computer vision systems.
Computer vision has achieved remarkable results, especially in recent years, outperforming humans in most tasks. Still, CV systems are highly dependent on the data they are trained on and can learn to amplify the bias within such data. Thus, it has become of utmost importance to identify bias and mitigate bias.
This article will explore the key types of bias in computer vision, the techniques used to detect and mitigate them, and the essential tools and best practices for building fairer CV systems. Let’s get started.
Bias Detection in Computer Vision: A Guide to Types and Origins
Artificial Intelligence (AI) bias detection generally refers to detecting systematic errors or prejudices in AI models that amplify societal biases, leading to unfair or discriminatory outcomes. While bias in AI systems is a well-established research area, the field of biased computer vision hasn’t received as much attention.
This is concerning considering the vast amount of visual data used in machine learning today and the heavy reliance of modern deep learning techniques on this data for tasks like object detection and image classification. These biases in computer vision data can manifest in concerning ways, leading to potential discrimination in real-world applications like targeted advertising or law enforcement.
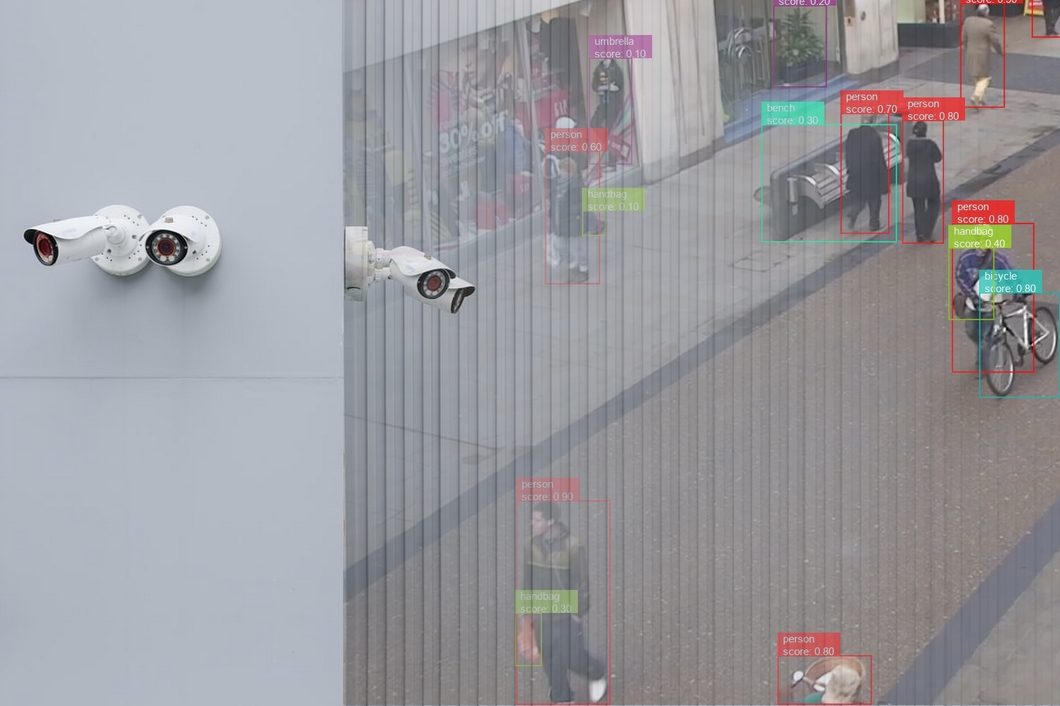
Understanding the types of bias that can corrupt CV models is the first step toward bias detection and mitigation. It’s important to note that the categorization of visual dataset bias can vary between sources.
This section will list the most common bias types in visual datasets for computer vision tasks. This section will use the framework outlined here.
Selection Bias
Selection bias (also called sample bias) occurs when the way images are chosen for a dataset introduces imbalances that don’t reflect the real world. This means the dataset may over- or underrepresent certain groups or situations, leading to a potentially unfair model.
Certain kinds of imagery are more likely to be selected when collecting large-scale benchmark datasets, as they depend on images collected from readily available online sources with existing societal biases or automatic scraping and filtering methods.
This makes it crucial to understand how to detect sample bias within these datasets to ensure fairer models. Here are a few examples:
- Caltech101 dataset: Car pictures are mostly taken from the side
- ImageNet: Contains more racing cars.
While such imbalances might seem less consequential, selection bias becomes much more critical when applied to images of humans.
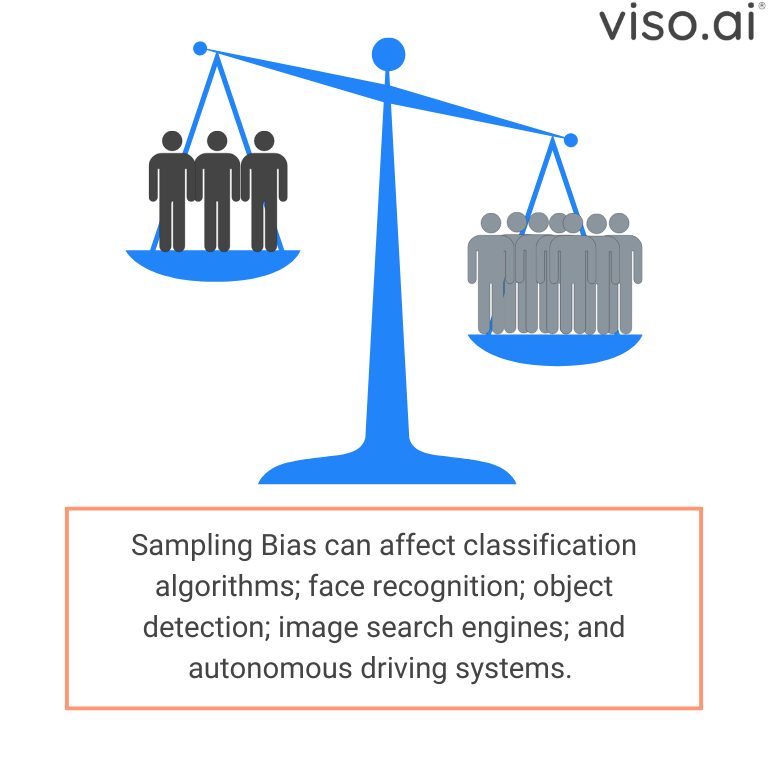
Under-representation of diverse groups can lead to models that misclassify or misidentify individuals based on protected characteristics like gender or ethnicity, resulting in real-world consequences.
Studies revealed that the error rate for dark-skinned individuals could be 18 times higher than that for light-skinned individuals in some commercial gender classification algorithms.
Facial recognition algorithms are one of the areas affected by sampling bias, as they can cause different error rates depending on the data it was trained on. Hence, such technology would require much more care, especially in high-impact applications like law enforcement. However, it is worth noting that even though this class imbalance has a significant impact, they do not explain every disparity in the performance of machine learning algorithms.
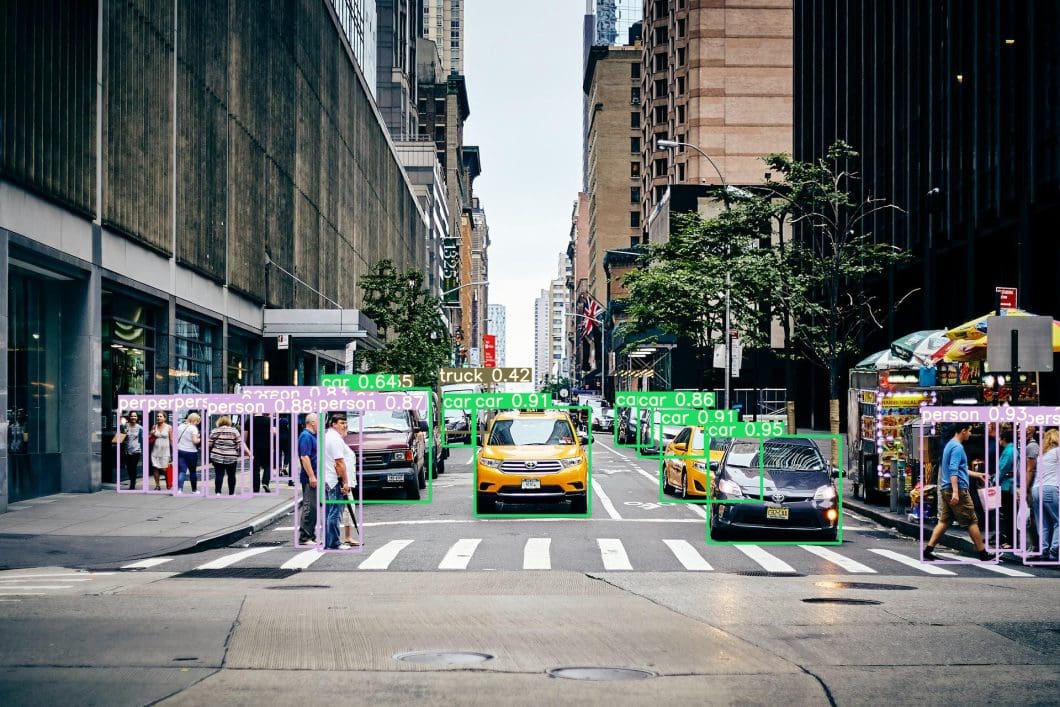
Another example is autonomous driving systems, as it is very challenging to collect a dataset that describes every possible scene and situation a car might face.
Framing Bias
Framing bias refers to how images are captured, composed, and edited in a visual dataset, influencing what a computer vision model learns. This bias encompasses the impact of visual elements like angle, lighting, cropping, and technical choices such as augmentation during image collection. Importantly, framing bias differs from selection bias, as each presents its twist.
One example of framing bias is capture bias. Research indicates that representations of overweight individuals in images can be significantly different in visual content, with headless images occurring far more frequently compared to pictures of individuals who are not overweight.
These sorts of images often find their way into large datasets used to train CV systems, like image search engines.
Even for us, our decisions are influenced by how certain things are framed, as this is a widely used marketing strategy.
For example, a customer will choose an 80% fat-free milk bottle over a bottle with 20% fat, even though they convey the same thing.

Framing bias in image search can lead to results that perpetuate harmful stereotypes, even without explicit search terms. For example, a search for a general profession like “construction worker” might result in gender imbalances in representation. Regardless of whether the algorithm itself is biased or simply reflects existing biases, the result amplifies negative representations. This underscores the importance of bias detection in CV models.
Label Bias
Labeled data is essential for supervised learning, and the quality of those labels is crucial for any machine learning model, especially in computer vision. Labeling errors and biases can be quite common in today’s datasets because of their complexity and volume, making detecting bias within those datasets challenging.
We can define label bias as the difference between the labels assigned to images and their ground truth, this includes mistakes or inconsistencies in how visual data is categorized. This can happen when labels don’t reflect the true content of the image, or when the label categories themselves are vague or misleading.

Nevertheless, this becomes particularly problematic with human-related images. For example, label bias can include negative set bias where labels fail to represent the full diversity of a category: non-white people in a binary feature as white people and non-white/people of color.
To address challenges like racial bias, using specific visual attributes or measurable properties (like skin reflectance) is often more accurate than subjective categories like race. A classification algorithm trained on biased labels will likely reinforce those biases when used on new data. This highlights the importance of bias detection early in the lifecycle of visual data.
Visual Data Life Cycle
Understanding how to detect bias at its source is crucial. The lifecycle of visual content offers a helpful framework for this. It shows that bias can be introduced or amplified at multiple stages.
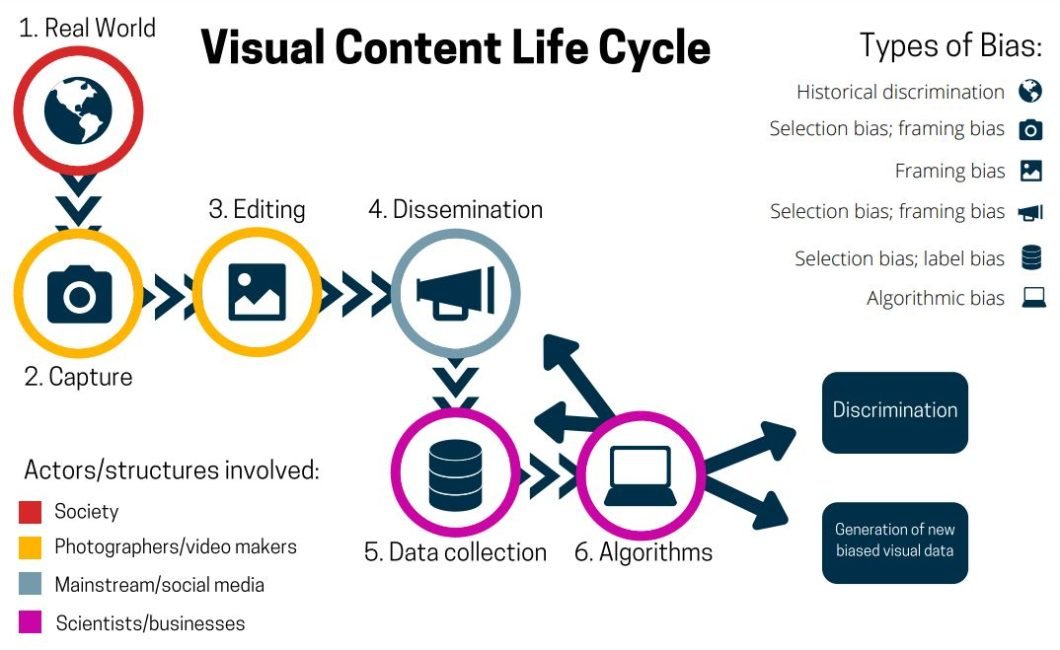
The lifecycle shows potential for biases like capture bias (camera angles influencing perception). Other biases can also occur during the lifecycle of visual content, according to the processes shown in the illustration. This includes availability bias (using easily available data), or automation bias (automating the labeling and/or collection process).
In this guide, we mentioned the major types, as other biases are usually subcategories. These biases often interact and create overlaps because different kinds of bias can co-occur, making bias detection even more crucial.
Bias Detection Techniques In Computer Vision
Detecting bias in visual datasets is a critical step towards building fair and trustworthy CV systems. Researchers have developed a range of techniques to uncover these biases, ensuring the creation of more equitable models. Let’s explore some key approaches.
Reduction To Tabular Data
This category of methods focuses on the attributes and labels associated with images. By extracting this information and representing it in a tabular format, researchers can apply well-established bias detection methods developed for tabular datasets.
The features extracted for this tabular representation can come directly from images using image recognition and detection tools, or from existing metadata like captions, or a combination of both. Further analysis of the extracted tabular data reveals different ways to assess potential bias.
Common approaches can be roughly categorized into:
- Parity-based methods (Measure of Equality)
- Information theory (Analyzing Redundancy)
- Others
One way to assess dataset bias is through parity-based methods, which examine label assignments like age and gender to different groups within visual data using recognition models.
Here are some of the statistical results for ImageNet Subsets using a parity-based approach.

Detecting bias using information theory methods is also quite popular, especially in facial recognition datasets. Researchers utilize these techniques to analyze fairness and create more balanced datasets. Other reduction-to-tabular methods exist, and research continues to explore new and improved techniques for bias detection in tabular data.
Biased Image Representations
While reducing image data to tabular data can be valuable, sometimes analyzing the image representations offers unique insights into bias. These methods focus on lower-dimensional representations of images, which reveal how a machine learning model might “see” and group them. They rely on analyzing distances and geometric relations of images in a lower-dimensional space to detect bias.
Methods in this category include Distance-based and other methods. To use these methods, researchers study how pre-trained models represent images in a lower-dimensional space, and calculate distances between those representations to detect bias within visual datasets.
The graph below shows the distribution of races within popular face datasets using image representation methods:
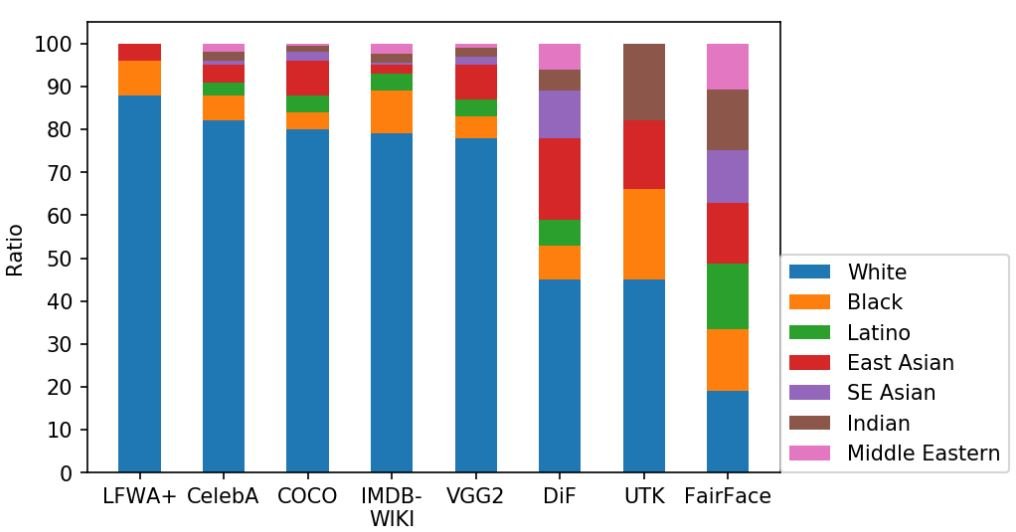
Distance-based methods can also reveal biases that mirror human stereotypes. Researchers have analyzed how models represent different concepts (like “career” or “family”) in lower-dimensional spaces. By measuring the similarity between these representations, they can detect potentially harmful associations (e.g., if “career” representations are closer to images of men than images of women).
Other methods in this category include manipulating the latent space vectors using generative models like GANs as a bias detection tool. Researchers modify specific latent representations (e.g., hair, gender) to observe the model’s response. These manipulations can sometimes lead to unintended correlations, likely due to existing biases in the dataset.
Cross-dataset Bias Detection
Cross-dataset bias detection methods compare different datasets, searching for “signatures” that reveal biases. This concept of a “signature” comes from the fact that experienced researchers can often identify which benchmark dataset an image comes from with good accuracy.
These signatures (biases) are unique patterns or characteristics within a dataset that usually affect the ability of a model to generalize well on new unseen data. Cross-data generalization is one approach used in this category, which tests how well a model generalizes to a representative subset of data it was not trained on.
Researchers have proposed a metric to score the performance of a model on new data against its native data; the lower the score, the more bias in the native data of the model. A popular related test, called “Name the Dataset” involves the SVM linear classifier trained to detect the source dataset of an image.
The higher the model’s accuracy, the more distinct and potentially biased the datasets were. Here is what this test looks like:
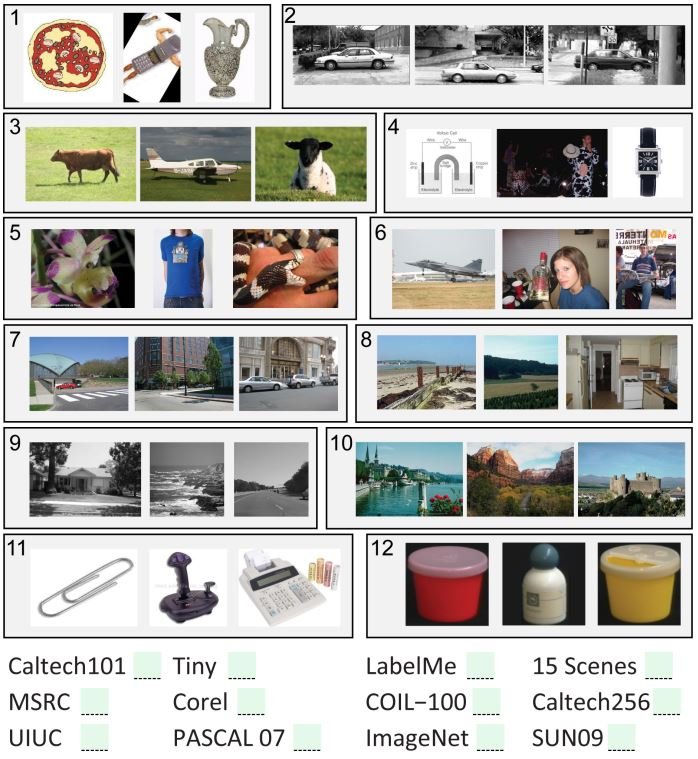
This task proved surprisingly easy for humans working in object and scene recognition. In other efforts, researchers used CNN feature descriptors and SVM binary classifiers to help with detecting bias in visual datasets.
Other Methods
Some methods do not fall under any of the categories mentioned so far. In this subsection, we will explore XAI as one advancement that helped bias detection.
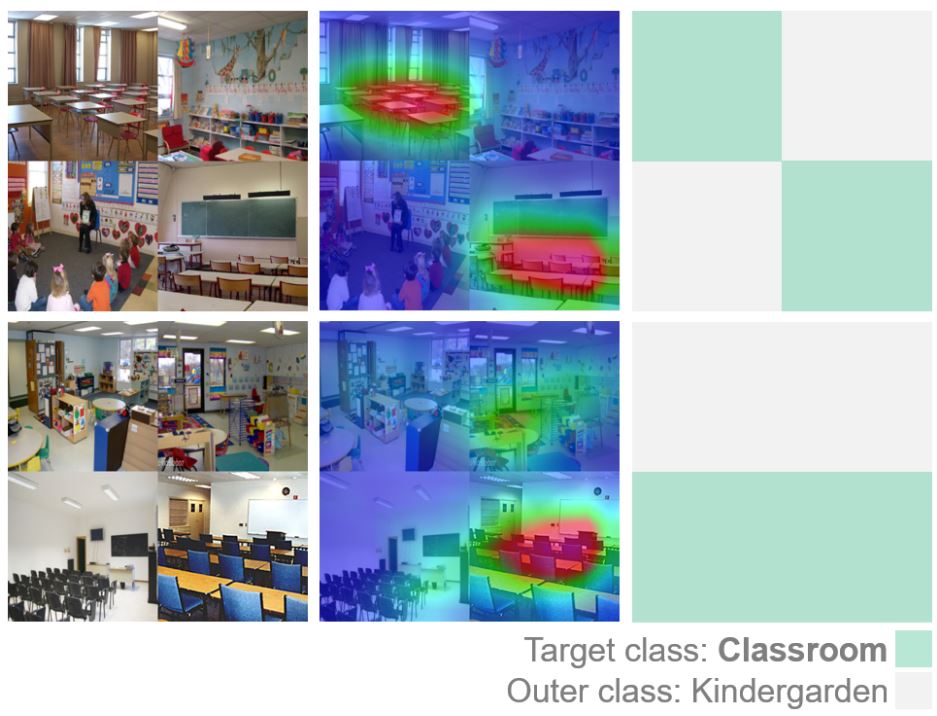
Deep learning models are black-box methods by nature, and even though those models have succeeded the most in CV tasks, explainability is still poorly assessed. Explainable AI improves the transparency of those models, making them more trustworthy.
XAI offers several techniques to identify potential biases within deep learning models:
- Saliency Maps: These highlight regions in an image that are most influential in the model’s decision. A focus on irrelevant elements might flag potential bias.
- Feature Importance: By identifying which attributes (e.g., colors, shapes) the model prioritizes, it can uncover reliance on biased attributes.
- Decision Trees/Rule-Based Systems: Some XAI methods create decision trees or rule-based systems that mimic a model’s logic, making a model’s logic more transparent, which can expose bias in its reasoning.
Detecting bias is the first step towards addressing it. In the next section, let’s explore specific tools, techniques, and best practices developed by researchers and practitioners as actionable steps for mitigation.
Bias Detection in Computer Vision: A Guide To Mitigation
Building on the bias detection techniques we explored previously, researchers analyze popular benchmark datasets to detect the types of bias present in them and inform the creation of fairer datasets.
Since dataset bias leads to algorithmic bias, mitigation strategies usually focus on best practices for dataset creation and sampling. This approach allows us to have a bias-aware visual data collection process, to minimize bias from the foundation of CV models.
Informed by researcher-led case studies, this section outlines actionable mitigation techniques divided into three focus areas:
- Dataset Creation
- Collection Processes
- Broader Considerations
Dataset Creation
- Strive for Balanced Representation: Combat selection bias by including diverse examples in terms of gender, skin tone, age, and other protected attributes. Oversampling under-represented groups or carefully adjusting dataset composition can promote this balance. E.g., a dataset including only young adults could be balanced by adding images of seniors.
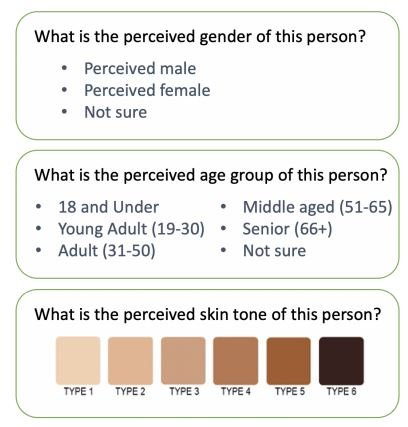
- Critically Consider Labels: Be mindful of how labels can introduce bias, and consider more refined labeling approaches when possible. Imposing categories like overly simplistic racial categories can itself be a form of bias. E.g., Instead of “Asian”, include more specific regional or cultural identifiers if relevant.
- Crowdsourcing Challenges: Crowdsourced annotators usually have inconsistencies, as individual annotators could have potential biases. So, if using crowdsourced annotations, make sure to implement quality control mechanisms. E.g., Provide annotators with clear guidelines and training on potential biases.
Collection Process
- Represent Diverse Environments: To avoid framing bias, make sure to capture diversity in lighting, camera angles, backgrounds, and subject representation. Introducing synthetic data can give more variety to the settings of the images. This will avoid overfitting models to specific contexts or lighting conditions and allow for an adequate sample size. E.g., Photos taken both indoors and outdoors.
- Be Mindful of Exclusion: Consider the potential impact of removing certain object classes on model performance. This will also affect negative examples, removing general object classes (“people,” “beds”) can skew the balance.
Broader Considerations
- Expand Geographic Scope: Geographic bias is one type of sample bias. This bias exists in a wide range of datasets that are US-centric or European-centric. So, it is important to include images from diverse regions to combat this bias. E.g., Collect images from countries across multiple continents.
- Acknowledge Identity Complexity: Binary gender labels sometimes fail to reflect gender identity, requiring different approaches. Thus, inclusive representation in datasets can be helpful.
Checklist
Lastly, consider using the checklist below for bias-aware visual data collection from the paper: “A Survey on Bias in Visual Datasets.”
| General | Selection Bias | Framing Bias | Label Bias |
|---|---|---|---|
| What are the purposes the data is collected? | Do we need balanced data or statistically representative data? | Are there any spurious correlations that can contribute to framing different subjects in different ways? | If the labelling process relies on machines, have their biases been taken into account? |
| Are there uses of the data that should be discouraged because of possible biases? | Are the negative sets representative enough? | Are there any biases due to the way images/videos are captured? | If the labelling process relies on human annotators, is there an adequate and diverse pool of annotators? Have their possible biases been taken into account? |
| What kinds of bias can be inserted by the way the collection process is designed? | Is there any group of subjects that is systematically excluded from the data? | Did the capture induce some behavior in the subjects? (e.g., smiling when photographed?) | If the labelling process relies on crowd sourcing, are there any biases due to the workers’ access to crowd sourcing platforms? |
| Do the data come from or depict a specific geographical area? | Are there any images that could convey different messages depending on the viewer? | Do we use fuzzy labels? (e.g., race or gender) | |
| Does the selection of the subjects create any spurious associations? | Are subjects in a certain group depicted in a particular context more than others? | Do we operationalise any unobservable theoretical constructs/use proxy variables? | |
| Will the data remain representative for a long time? | Do the data agree with harmful stereotypes? |
In any of the mentioned focus areas, you can use adversarial learning techniques or fairness-enhancing AI algorithms. We refer to these as Explainable AI (XAI), mentioned in the bias detection section and used by researchers.
Adversarial learning techniques train models to resist bias by training them on examples that highlight those biases. Also, be mindful of trade-offs as mitigating one bias can sometimes introduce others.
A Brief Recap
This article provides a foundation for understanding bias detection in computer vision, covering bias types, detection methods, and mitigation strategies.
As noted in the previous sections, bias is pervasive throughout the visual data lifecycle. Further research must explore richer representations of visual data, the relationship between bias and latent space geometry, and bias detection in video. To reduce bias, we require more equitable data collection practices and a heightened awareness of biases within those datasets.
Learn More
To continue learning about computer vision systems, check out our other articles:
- Convolution Operations: an In-Depth 2024 Guide
- Object Localization and Image Localization
- Pandas: An Essential Python Data Analysis Library
- Understanding Visual Question Answering (VQA) in 2024
- Vision Language Models: Exploring Multimodal AI
- Machine Vision – What You Need to Know (Overview)
