True to its name, Explainable Artificial Intelligence (AI) refers to the tools and methods that explain intelligent systems and how they arrive at a certain output. Artificial Intelligence is used in every sphere of today’s digital world. Artificial Intelligence (AI) models assist across various domains, from regression-based forecasting models to complex object detection algorithms in deep learning.
For example, consider the case of the tumor detection CNN model used by a hospital to screen its patient’s X-rays. But how can a technician or the patient trust its result when they don’t know how it works? That’s exactly why we need methods to understand the factors influencing the decisions made by any deep learning model.
In this blog, we’ll dive into the need for AI explainability, the various methods available currently, and their applications.
Why do we need Explainable AI (XAI)?
The complexity of machine learning models has exponentially increased from linear regression to multi-layered neural networks, CNNs, transformers, etc. While neural networks have revolutionized the prediction power, they are also black-box models.
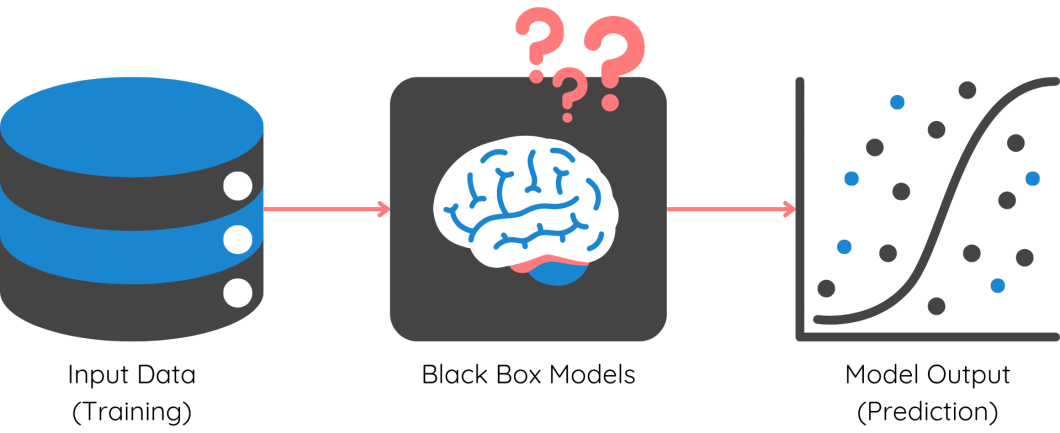
The architecture and mathematical computation that go under the hood are too complex to be deciphered by data scientists. We need a separate set of tools to interpret and understand them. Let’s look at the main reasons behind this:
- User Understanding and Trust: With Explainable AI, the transparency of how the decision is made increases. This would, in turn, increase the trust of end users, and adoption will also increase.
- Compliance and Regulations: Any company using AI for marketing recommendations, financial decisions, etc.. needs to comply with a set of regulations imposed by each country they operate. For example, it is illegal to use PII (Personal Identifiable Information) such as the address, gender, and age of a customer in AI models. With the help of XAI, companies can easily prove their compliance with regulations such as GDPR (General Data Protection Regulation).
- Identify & Remove Bias: AI models are mathematically error-proof, but they do not understand ethics and fairness. This is crucial, especially in industries like finance, banking, etc. For example, consider a bank’s credit risk prediction model. If the model provides a high-risk score to a customer based on their region neighborhood, or gender, then it is biased towards a specific section. XAI tools can show the influencing factors behind every prediction, helping us identify existing model biases.
- Continuous Improvement: Data scientists face many issues after model deployment, such as performance degradation, data drift, etc. By understanding what goes under the hood with Explainable AI, data teams are better equipped to improve and maintain model performance, and reliability.
- Error Detection and Debugging: A major challenge ML engineers face is debugging complex models with millions of parameters. Explainable AI helps identify the particular segments of an issue and errors in the system’s logic or training data.
Methodologies of Explainable AI (XAI)
Explainable AI offers tools and processes to explain different characteristics of both simply explainable ML models and the black box ones. For explainable models like linear and logistic regression, a lot of information can be obtained from the value of coefficients and parameters. Before we dive into the different methods, you need to know that ML models can be explained at two levels: Global and Local.
What are Global and Local Explanations?
Global Explanations: The aim of XAI at a global level is to explain the behavior of the model across the entire dataset. It gives insights into the main factors influencing the model, and the overall trends and patterns observed. This is useful to explain to business stakeholders how your model works.
For example, consider the case of risk modeling for approving personal loans to customers. Global explanations will tell the key factors driving credit risk across its entire portfolio and assist in regulatory compliance.
Local Explanations: The aim of XAI at the local level is to provide insights into why a particular decision was made for a specific input. Why do we need local explanations? Consider the same example of credit risk modeling.
Let’s say the bank notices poor performance in the segment where customers don’t have previous loan information. How will you know the specific factors at play for this segment? That’s exactly where local explanations help us with the roadmap behind every individual prediction of the model.
Local explanations are more helpful in narrowing down the existing biases of the model. Now, let’s take a look at a few prominently used methods:
SHAP
It is the most widely used method in Explainable AI, due to the flexibility it provides. It comes with the advantage of providing both local and global level explanations, making our work easier. SHAP is short for Shapley Additive Explanations.
Let us understand how Shapley’s values work with a hands-on example. I’ll be using the diabetes dataset to demonstrate in this blog. This dataset is available to the public in Kaggle. First, load and read the dataset into a pandas data frame.
# Import necessary packages
 import numpy as np
 import pandas as pd
 from sklearn.model_selection import train_test_split
 from xgboost import XGBClassifier
df = pd.read_csv('../input/pima-indians-diabetes-database/diabetes.csv')
 df.head()
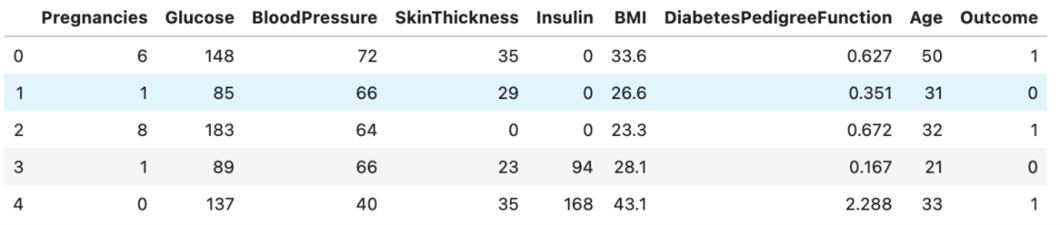
You can see that we have features (X) like glucose level, blood pressure, etc.. and the target is ‘Outcome’. If it is 1, then we predict the patient to have diabetes and be healthy if it is 0.
Next, we train a simple XGBoost model on the training data. These steps are shown in the below code snippet.
# Define features and target
 X = df.iloc[:, :-1]
 y = df.iloc[:, -1]
# Split the dataset into 75% for training and 25% for testing
 X_train, X_test, y_train, y_test = train_test_split(X, y, test_size=0.25, random_state=0)
model = XGBClassifier(random_state=42)
 model.fit(X_train, y_train)
 score = model.score(X_test, y_test)
Our model is ready and can be used to make predictions on the test data. First, Let’s understand how to interpret SHAP values locally – for a single prediction. Here’s how you can compute SHAP values for each prediction:
# Load the model into the TreeExplainer function of shap
 import shap
 explainer = shap.TreeExplainer(model)
 shap_values = explainer.shap_values(X)
You can now get a force plot for a single prediction on the test data using the code below:
shap.force_plot(explainer.expected_value, shap_values[0, :], X_test.iloc[0, :])
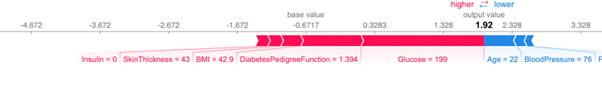
Here, the base value is the average prediction of the model. The contribution from each feature is shown in the deviation of the final output value from the base value. Blue represents positive influence, and pink represents negative influence (high chances of diabetes).
What if you want to know how all features affect the target at an overall level (global)?
You can visualize the impact magnitude and nature of each feature using the summary plot function that is available in the SHAP package:
shap.summary_plot(shap_values, X_test)
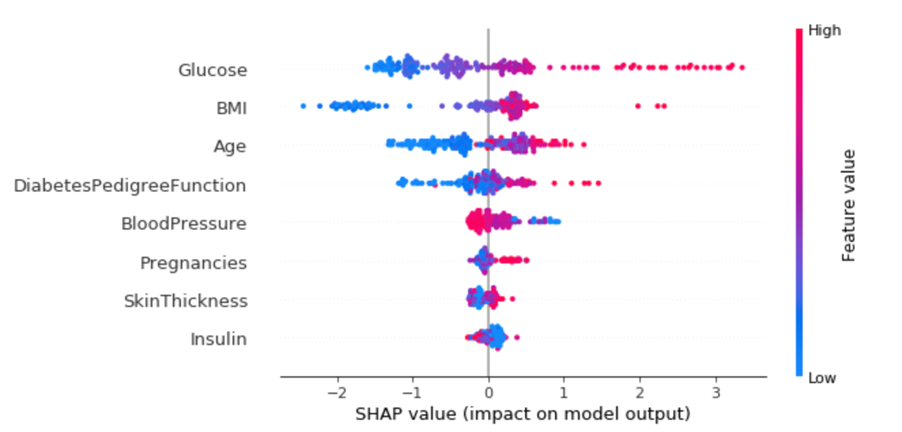
What can we say from this?
- High values of ‘Glucose’ mean higher chances of diabetes
- Low BMI and age would mean a low risk of diabetes
Put your skills to the test: Try to interpret other features similarly!
Overall, SHAP is a robust method that can be used on all types of models, but may not give good results with high dimensional data.
Partial Dependence Plots
It’s one of the simplest methods to understand how different features interact with each other and with the target. In this method, we change the value of one feature, while keeping others constant and observe the change in the dependent target.
This method allows us to identify regions where the change in feature values has a crucial impact on the prediction.
The Python partial dependence plot toolbox or PDPbox is a package that provides functions to visualize these. In the same case of diabetes prediction, let us see how to plot partial dependence plots for a single feature:
# Define feature names
 feature_names = ['Pregnancies', 'Glucose', 'BloodPressure','SkinThickness', 'Insulin','BMI', 'DiabetesPedigreeFunction', 'Age']
# Import module
 from pdpbox import pdp, get_dataset, info_plots
# Plot PDP for a single feature
 pdp_goals = pdp.pdp_isolate(model=model, dataset=X_test, model_features=feature_names, feature='Glucose')
 pdp.pdp_plot(pdp_goals, 'Glucose')
 plt.show()
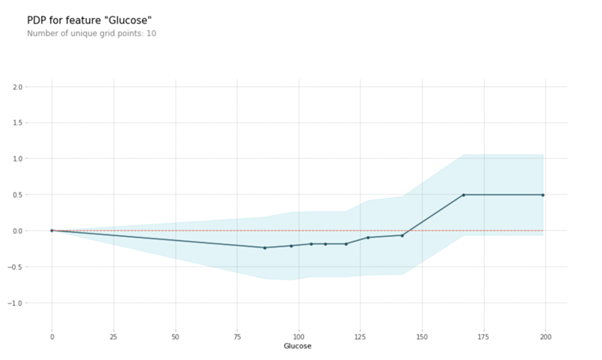
You can see the variation in target on the Y-axis for an increase in the ‘Glucose’ value on the X-axis. We can observe that when the glucose value ranges between 125 and 175, the impact is increasing at a higher rate.
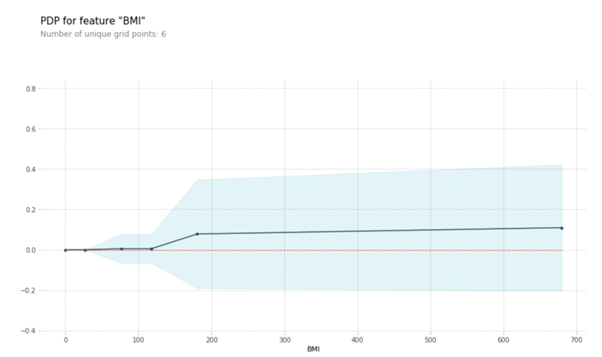
Let’s also look at the PDP of BMI. You can see that when BMI is less than 100, the target is almost constant. Post that, we see a linear increase.
PDP also allows you to visualize the interaction between two features, and their combined influence on the target. Let’s plot the interaction of BMI and Age below:
# Use the pdp_interact() function
 interaction = pdp.pdp_interact(model=model, dataset=X_test, model_features=feature_names, features=['Age','BMI'])
# Plot the graph
 pdp.pdp_interact_plot(pdp_interact_out=interaction, feature_names=['Age','BMI'], plot_type='contour', plot_pdp=True)
 plt.show()
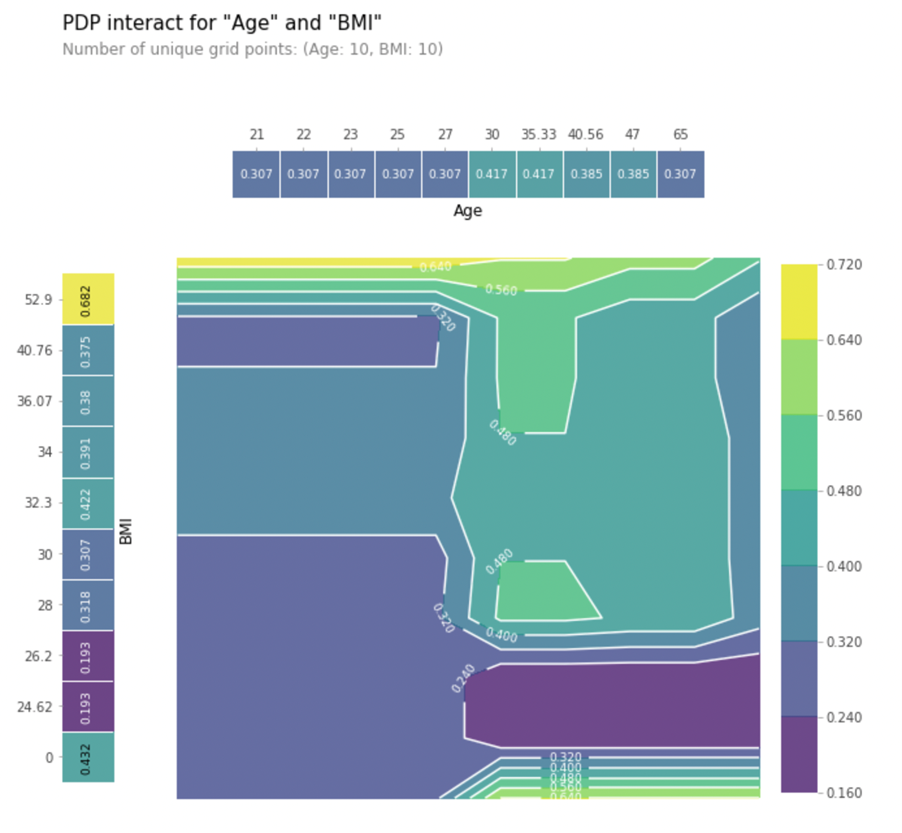
Observe how the color changes as you move across X-axis (Age) and Y-axis (BMI). You can observe that when the age is lower than 30, BMI has a higher impact. When the age is above 30, the interaction changes.
Permutation Feature Importance
It is a simple and intuitive method to find the feature importance and ranking for non-linear black box models. In this method, we randomly shuffle or change the value of a single feature, while the remaining features are constant.
Then, we check the model performance using relevant metrics such as accuracy, RMSE, etc., done iteratively for all the features. The larger the drop in performance after shuffling a feature, the more significant it is. If shuffling a feature has a very low impact, we can even drop the variable to reduce noise.
You can compute the permutation feature importance in a few simple steps using the Tree Interpreter or ELI5 library. Let’s see how to compute it for our dataset:
# Import the package and module
import eli5
from eli5.sklearn import PermutationImportance
# Pass the model and test dataset
my_set = PermutationImportance(model, random_state=34).fit(X_test,y_test)
eli5.show_weights(my_set, feature_names = X_test.columns.tolist())
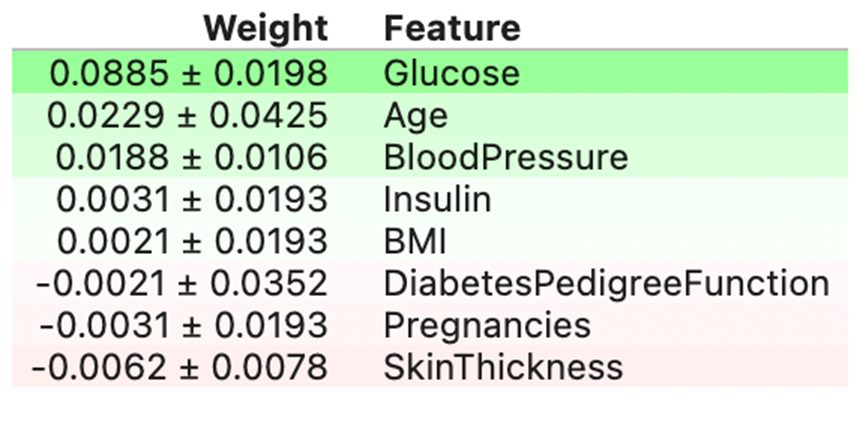
You’ll get an output like the above, with the feature importance and its error range. We can see that Glucose is the top feature, whereas Skin thickness has the least effect.
Another advantage of this method is that it can handle outliers and noise in the dataset. This explains the features at a global level. The only limitation is the high computation costs when the dataset sizes are high.
LIME
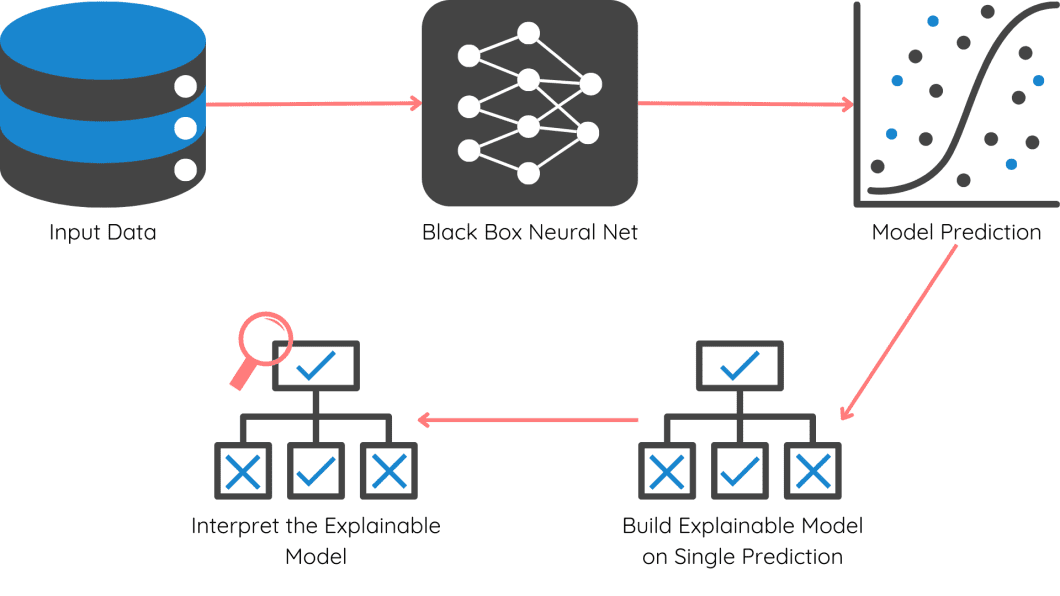
Local Interpretable Model-Agnostic Explanations (LIME) is widely used to explain black box models at a local level. When we have complex models like CNNs, LIME uses a simple, explainable model to understand its prediction.
To make it even easier to understand, let’s see how LIME works in a step-wise manner:
- Define your local point: Choose a specific prediction you want to explain (e.g., why an image was classified as a cat by a CNN).
- Generate variations: Create slight variations of the input data (e.g., slightly modified pixels in the image).
- Predict with the original model: Pass the input to CNN and get the predicted output class for each variation.
- Build an explainer model: Train a simple linear model to explain the relationship between the variations and the model’s predictions.
- Interpret the explainer: Now, you can interpret the explainer model with any method like feature importance, PDP, etc. to understand which features played a crucial role in the original prediction.
Apart from these, other prominent Explainable AI methods include ICE plots, Tree surrogates, Counterfactual Explanations, saliency maps, and rule-based models.
Real World Applications
Explainable AI is the bridge that builds trust between the world of technology and humans. Let’s look at some powerful explainable AI examples in our everyday world:
- Fair lending practices: Explainable AI (XAI) can provide banks with clear explanations for loan denials. Businesses can be risk-free from compliances and also improve the trust of their customer base
- Remove bias in recruitment: Many companies use AI systems to initially screen a large number of job applications. XAI tools can reveal any biases embedded in AI-driven hiring algorithms. This ensures fair hiring practices based on merit, not hidden biases.
- Increase adoption of autonomous vehicles: How many of you will trust a driverless car today? XAI can explain the decision-making process of self-driving cars on the road, like lane changes or emergency maneuvers. This will improve the trust of passengers.
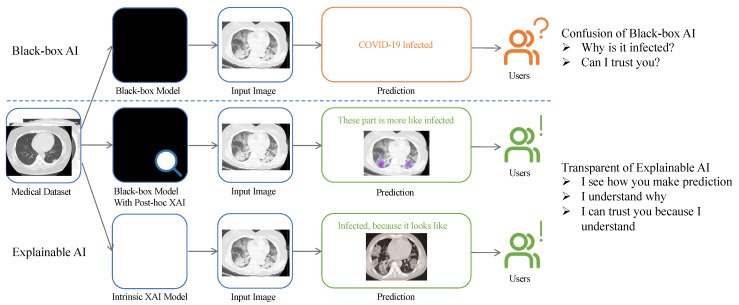
- Improve medical diagnostics: XAI can provide transparency in the diagnostic process by providing a post hoc explanation of model outputs, or diagnoses. This allows medical professionals to gain a more holistic view of the patient’s case at hand. Find an example involving diagnosing a COVID-19 infection in the image below.
What’s Next With XAI?
If deep learning explainable AI is to be an integral part of our businesses going ahead, we need to follow responsible and ethical practices. Explainable AI is the pillar for responsible AI development and monitoring.
Among the different XAI methods out there, you must decide based on your requirements for global or local explanations, data set size, legal requirements, regulatory requirements, computation resources available, etc. Global explanations might not capture the nuances of individual data points.
Local explanations can be computationally expensive, especially for complex models. The trade-off is where your industry knowledge will help you!